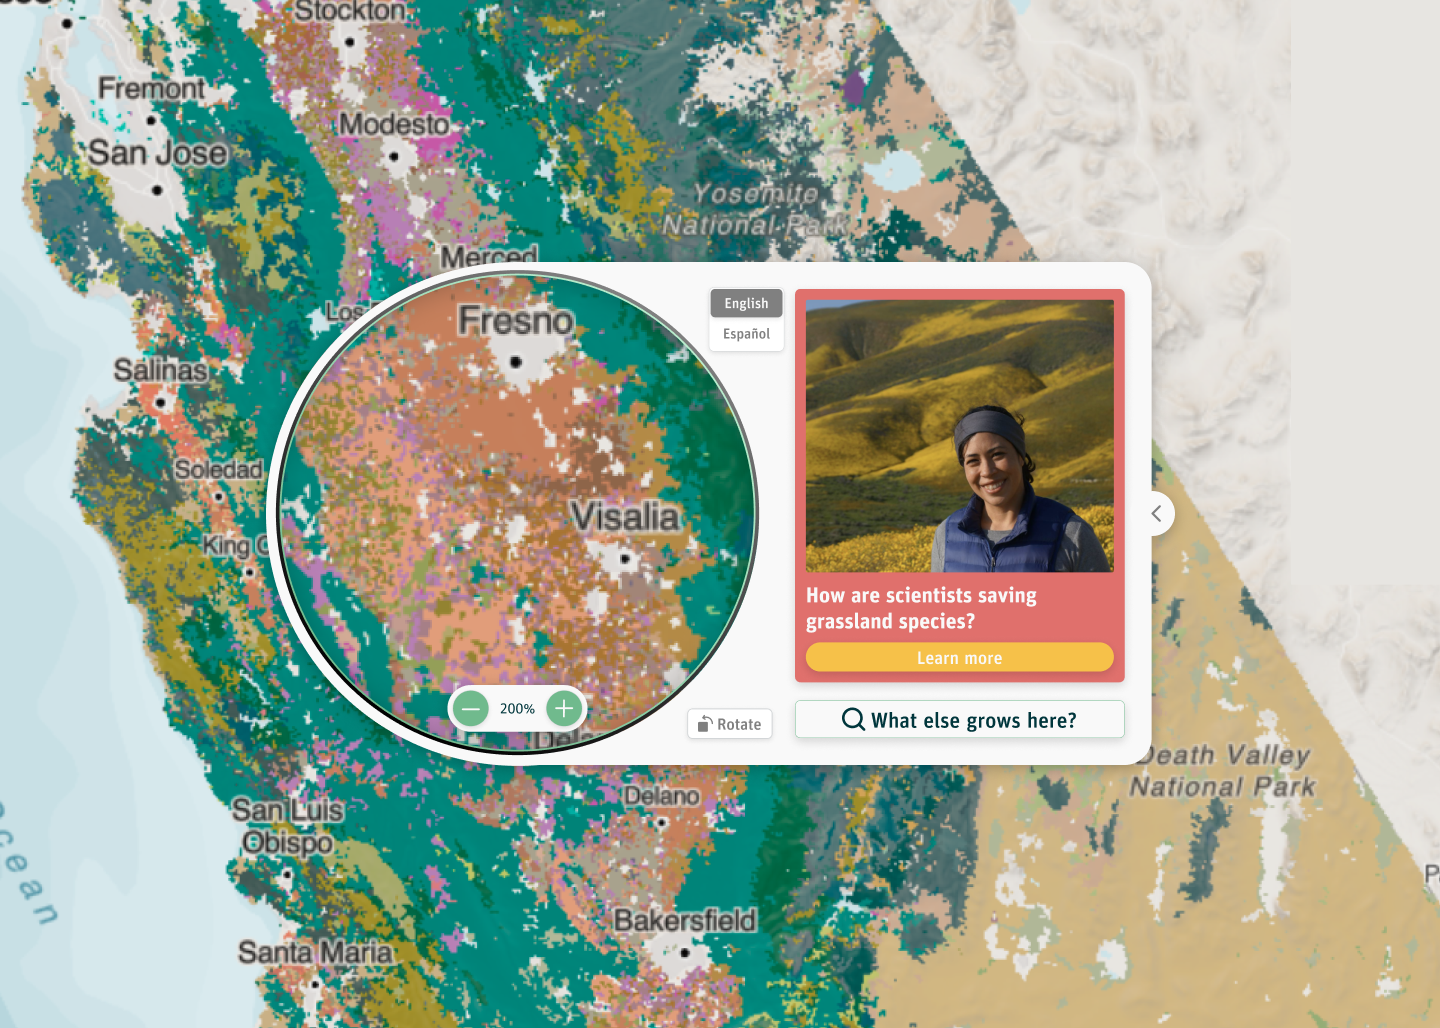
1/5 Data discovery
Define what success looks like and dive into the plant data.
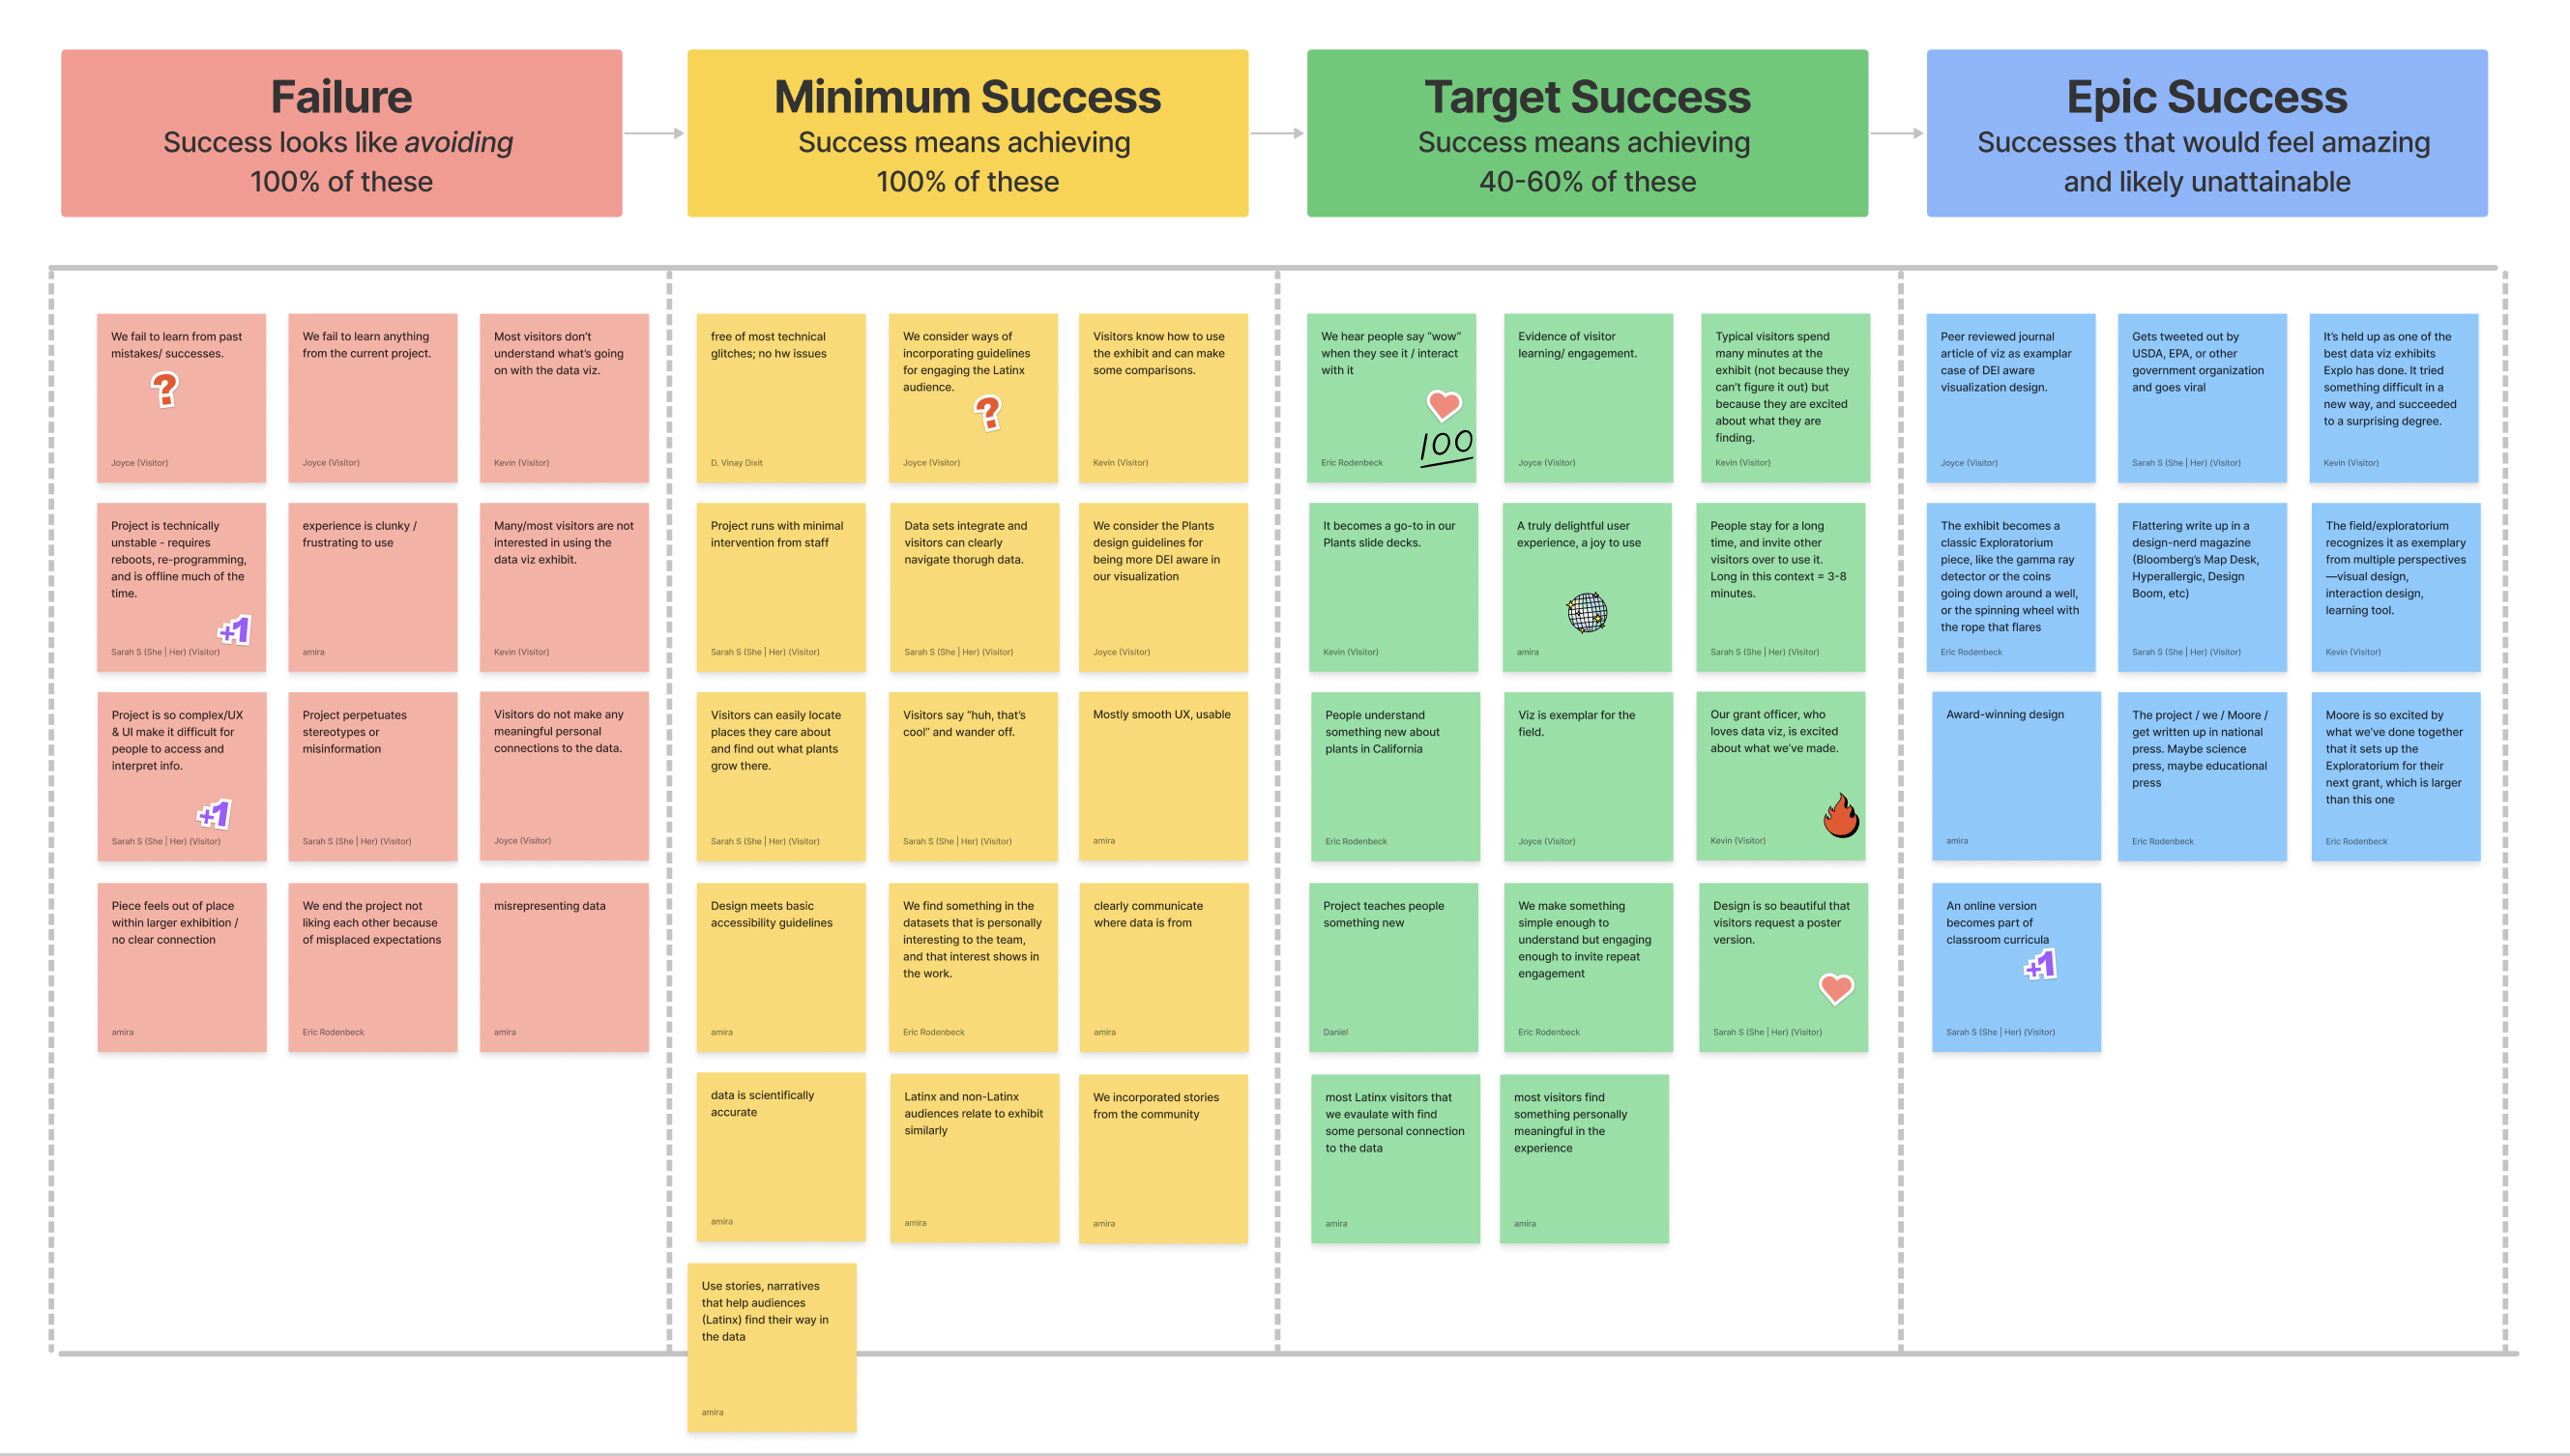
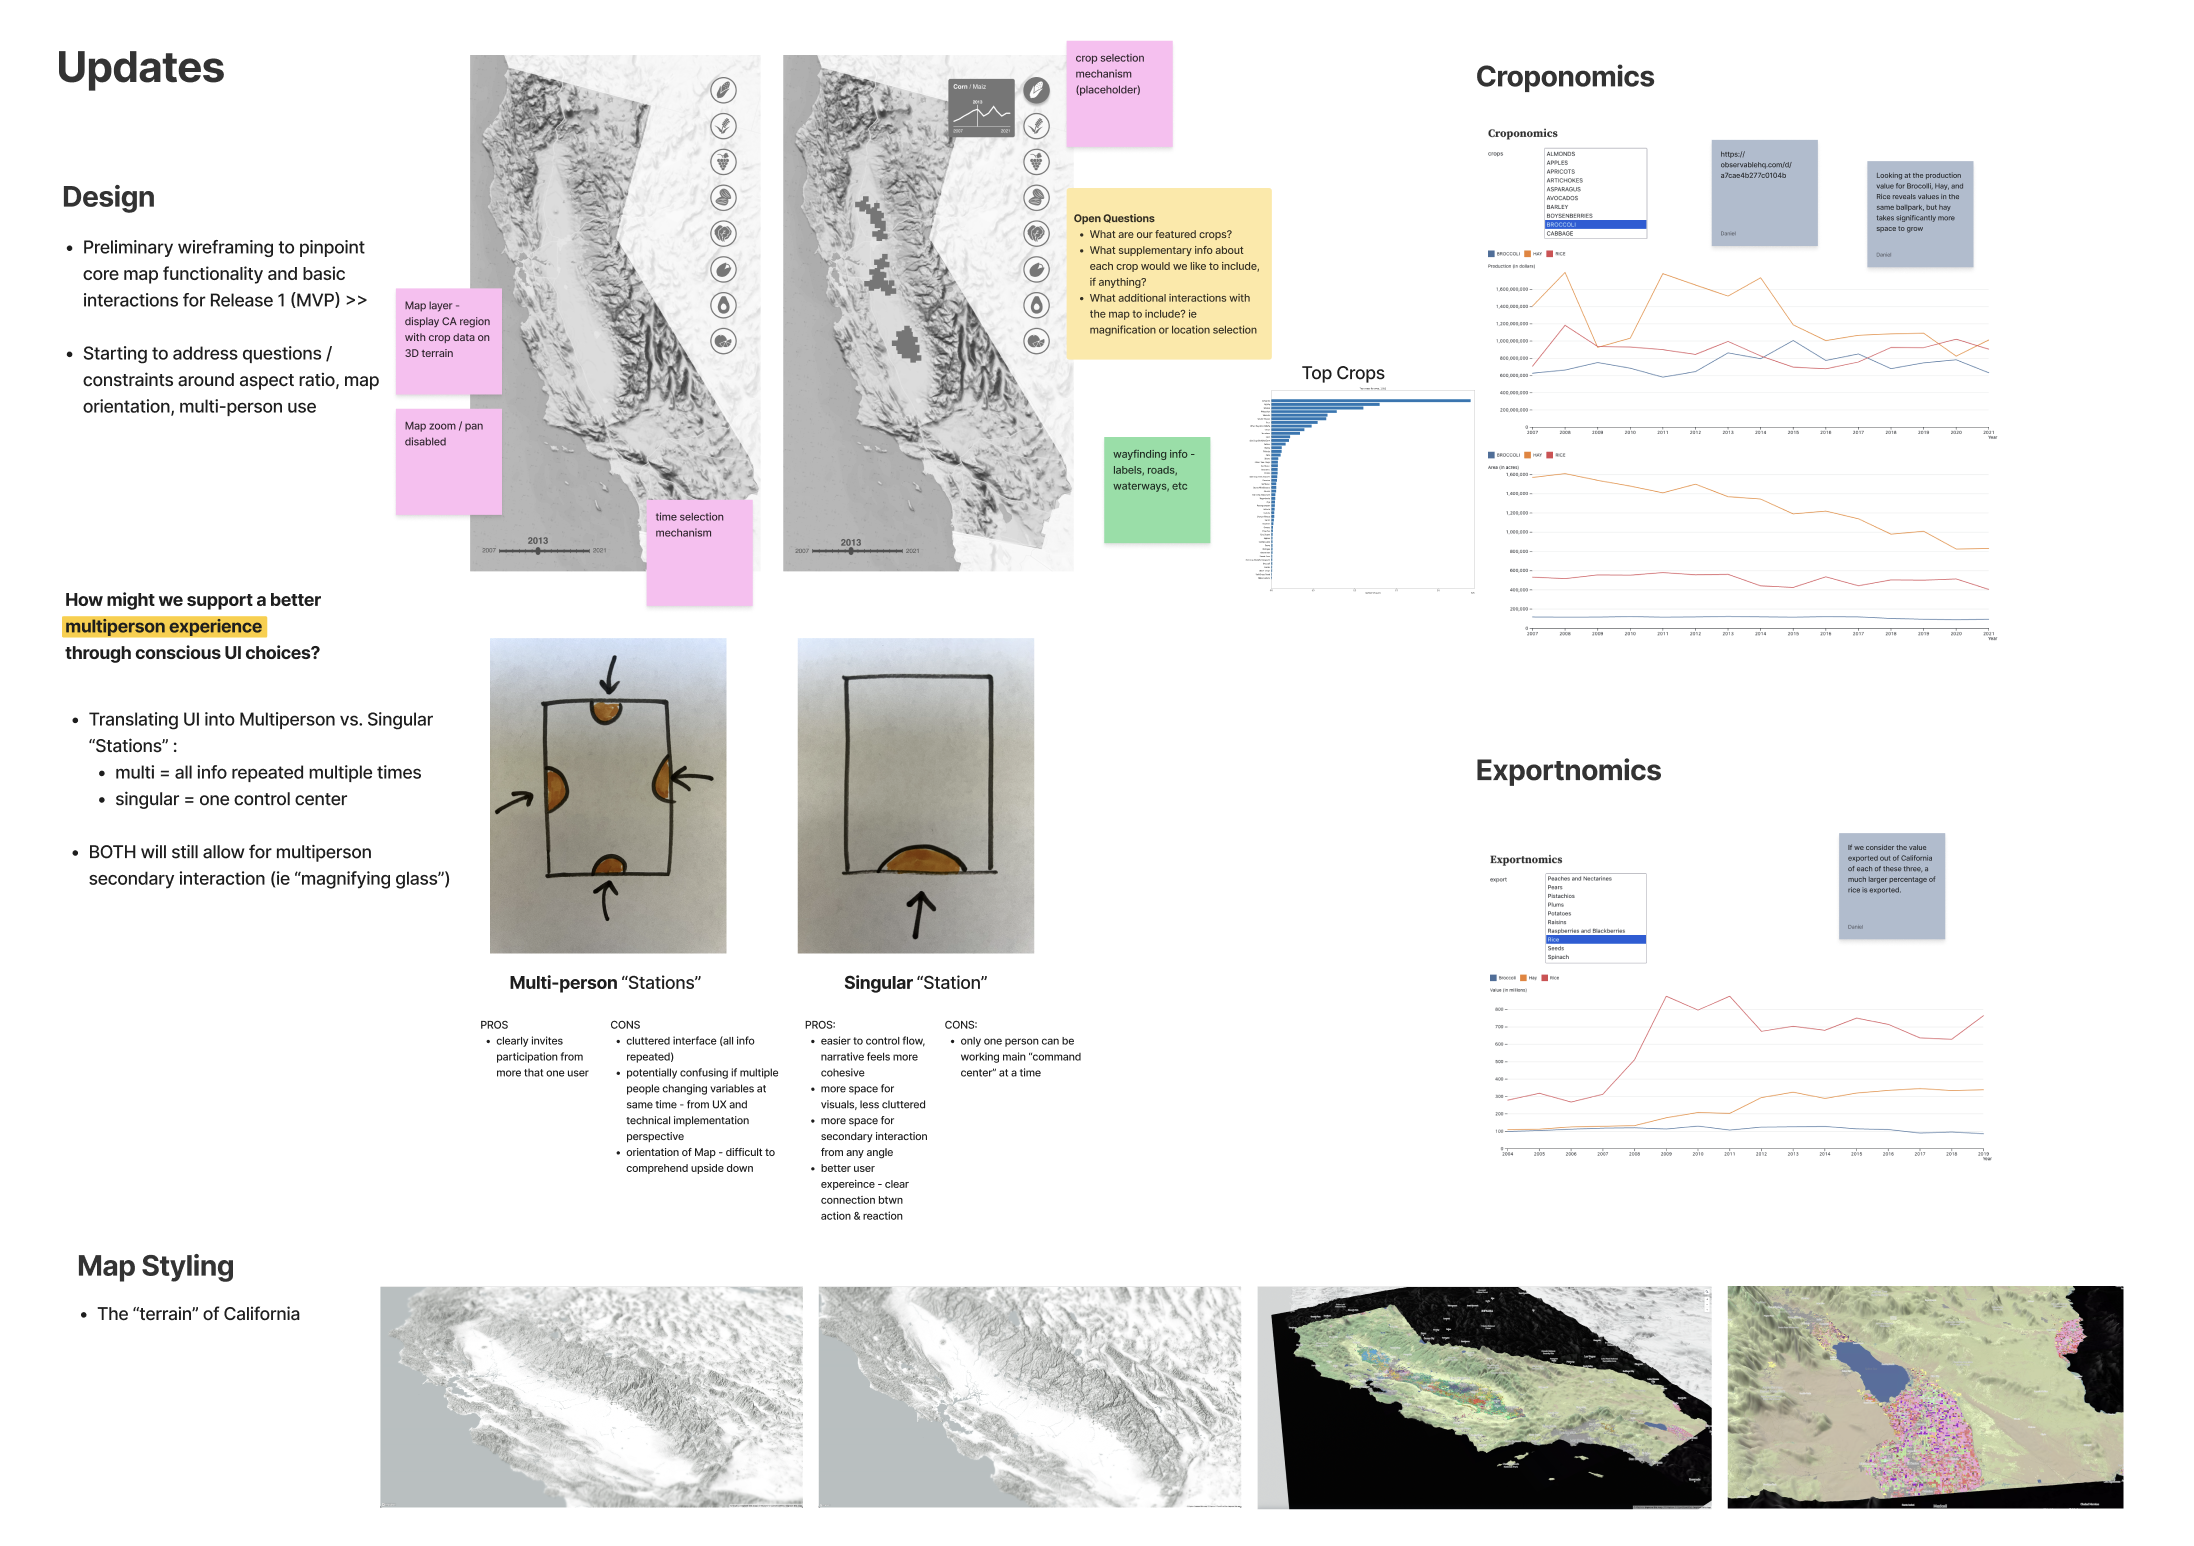
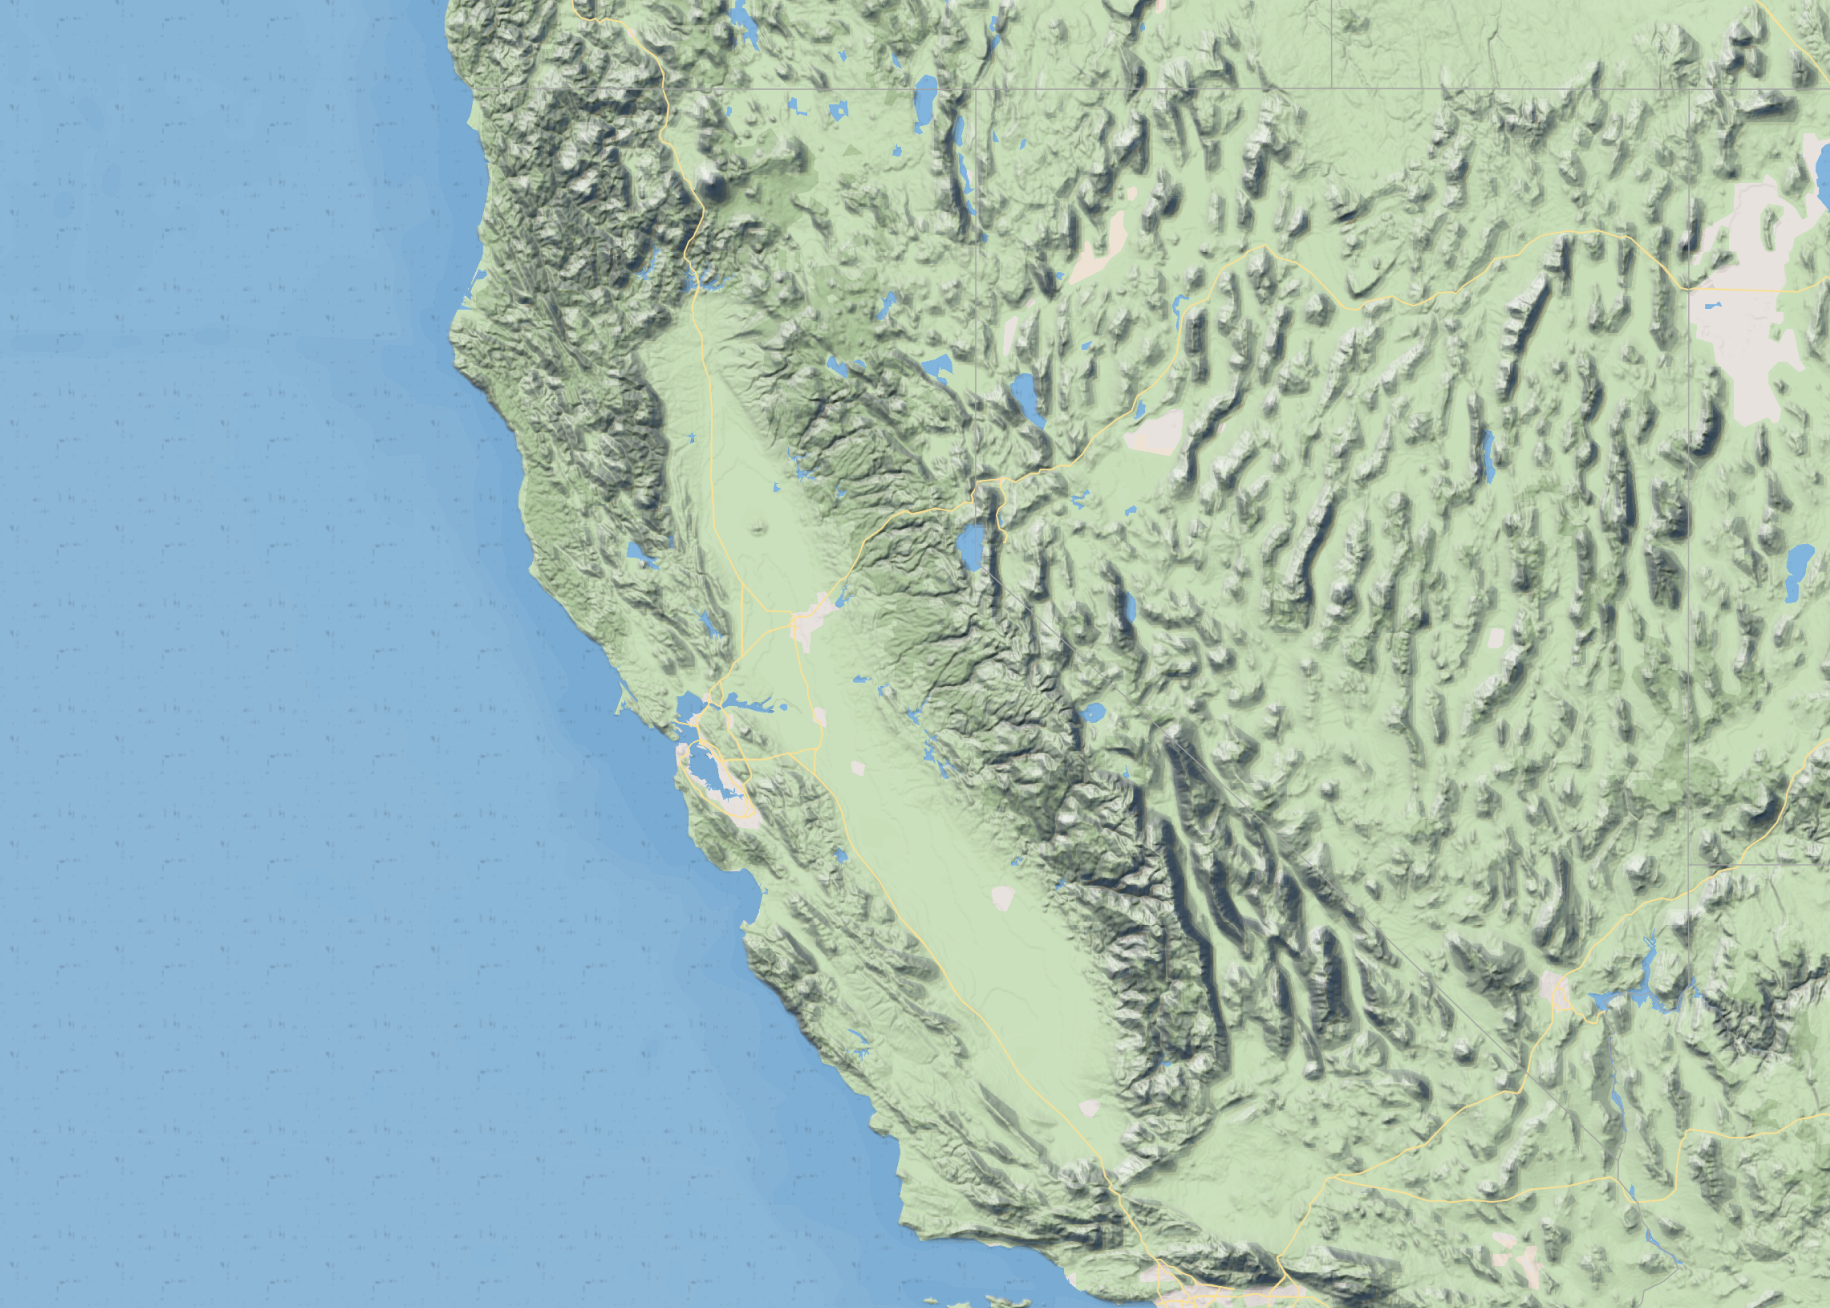
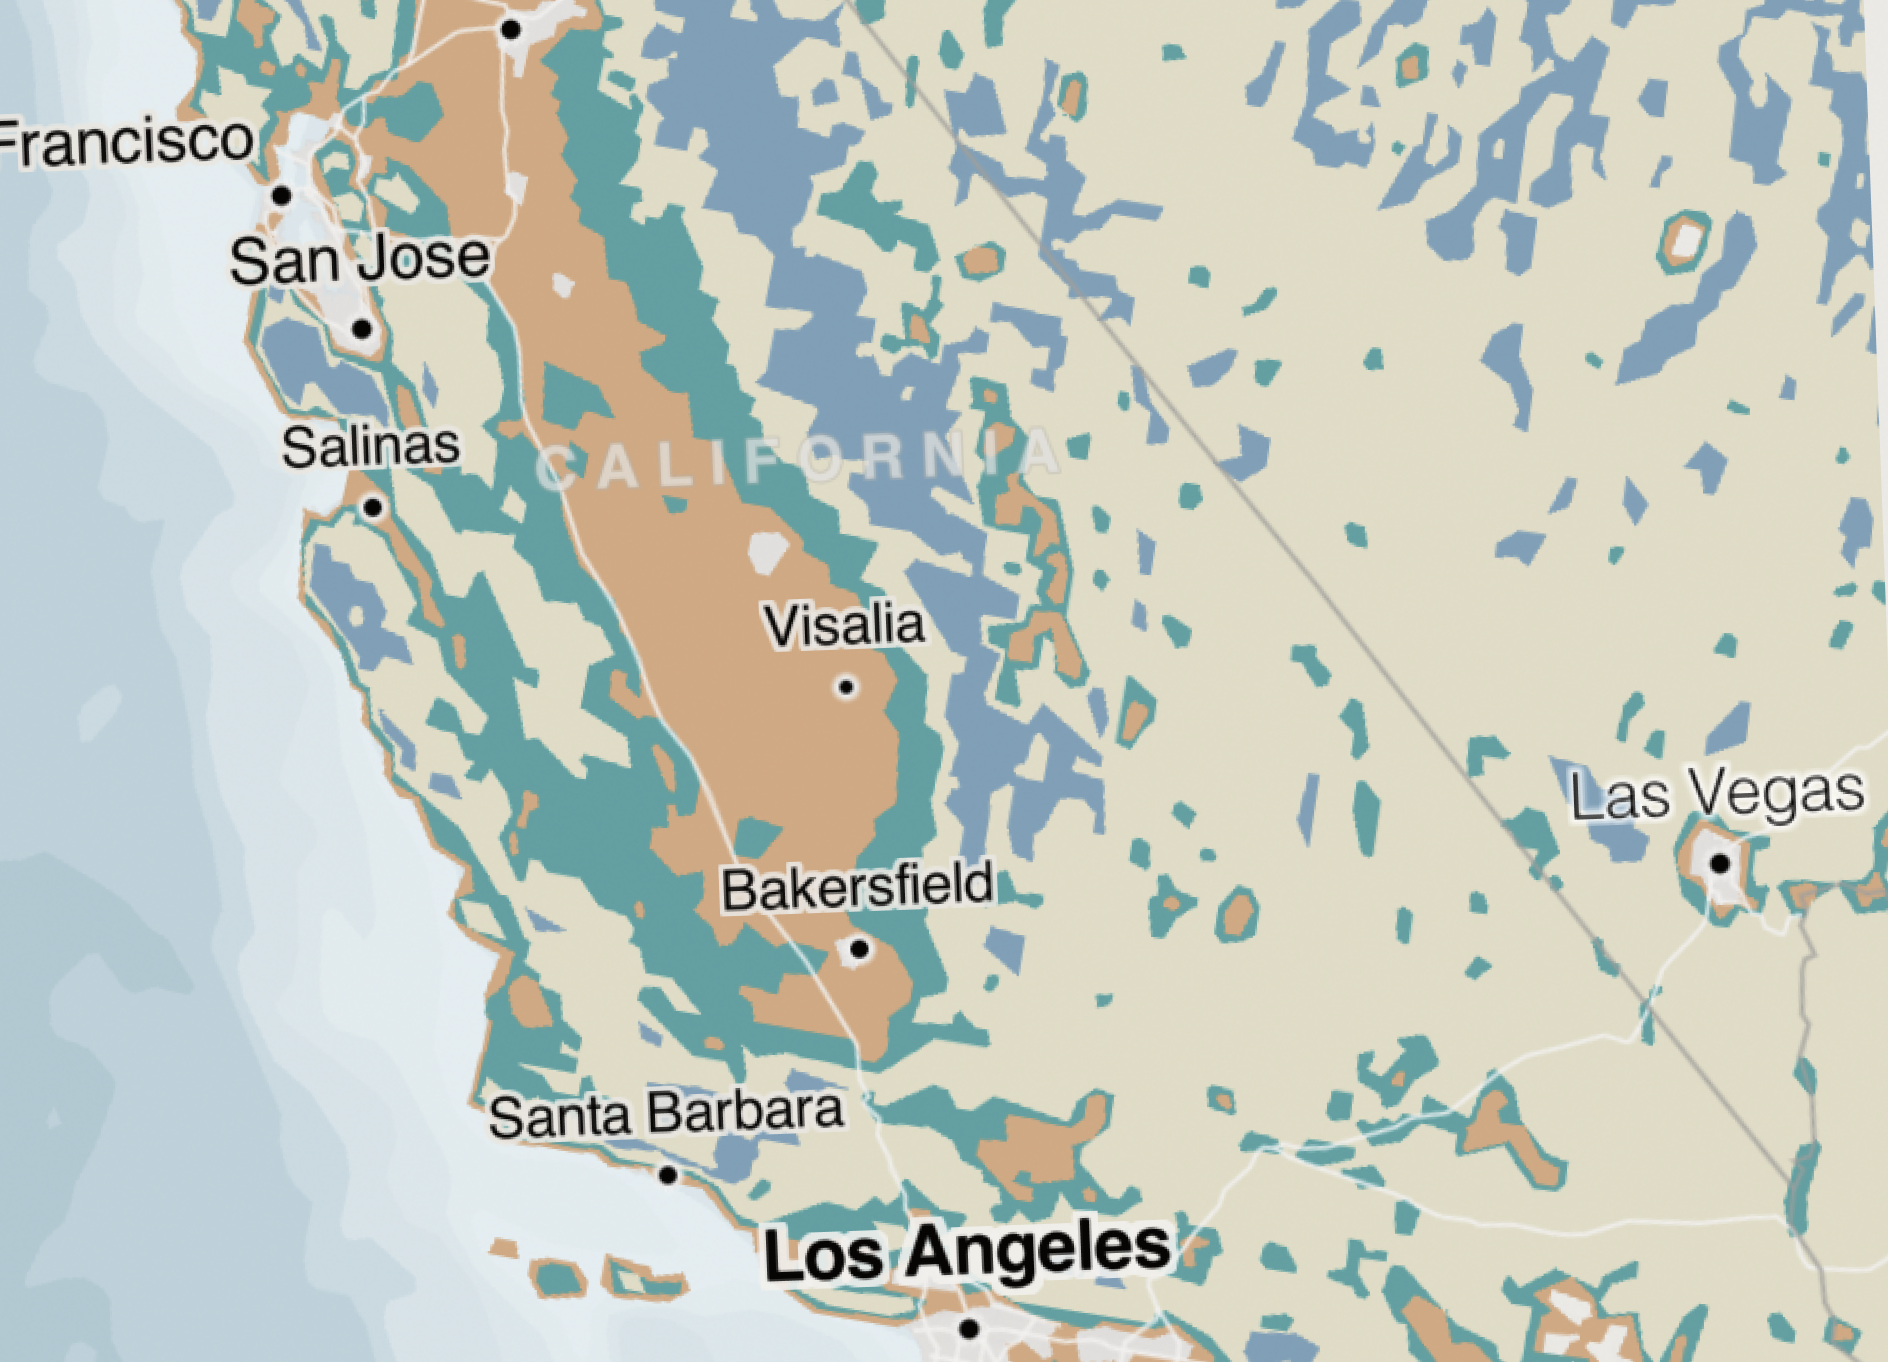
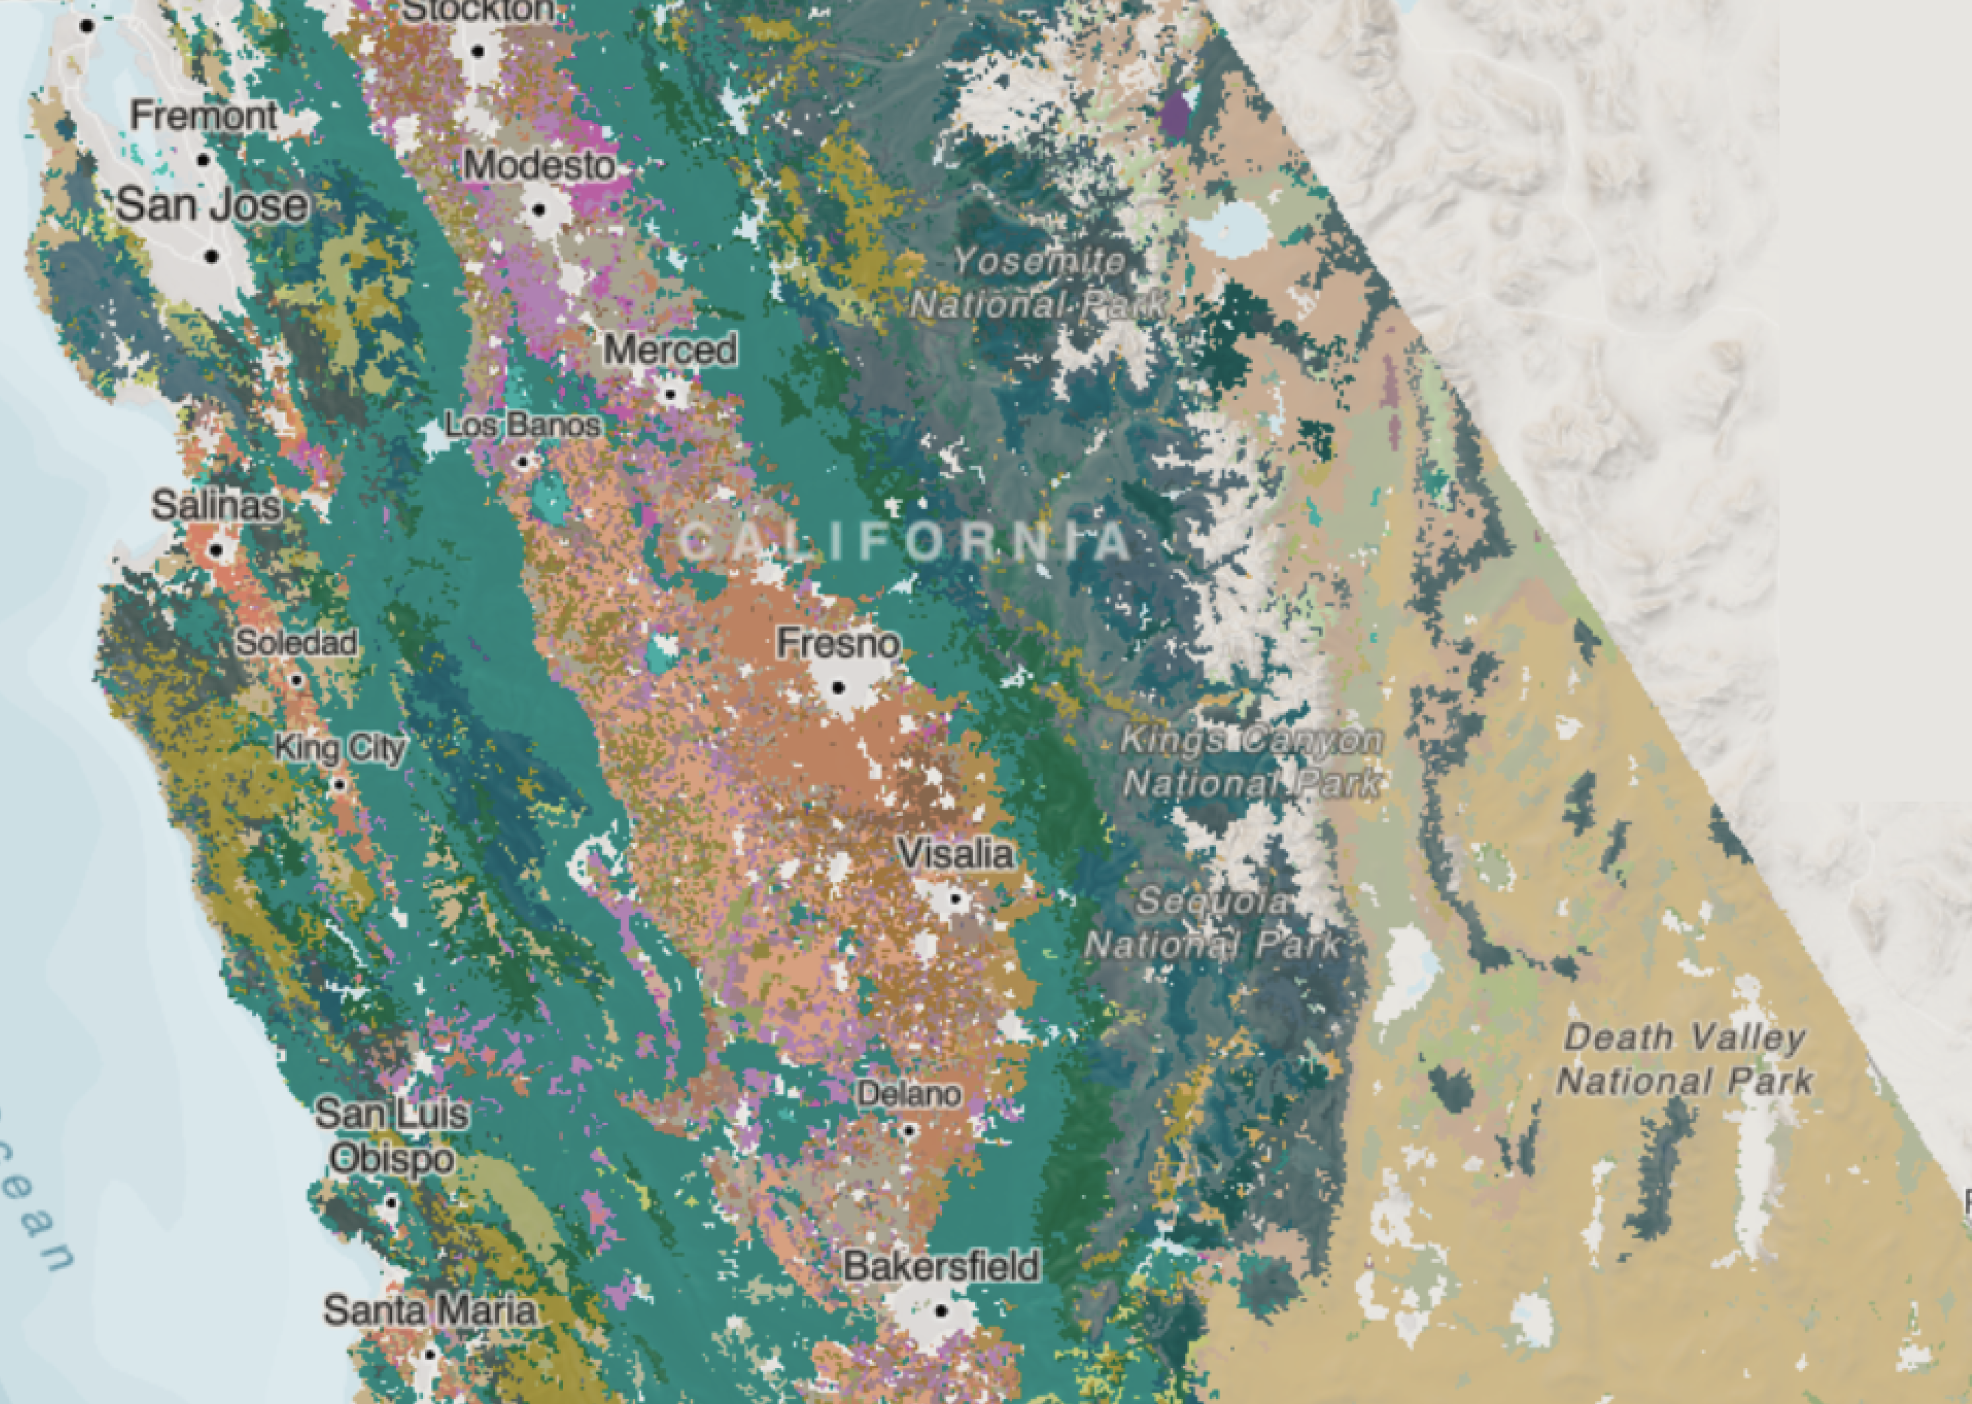
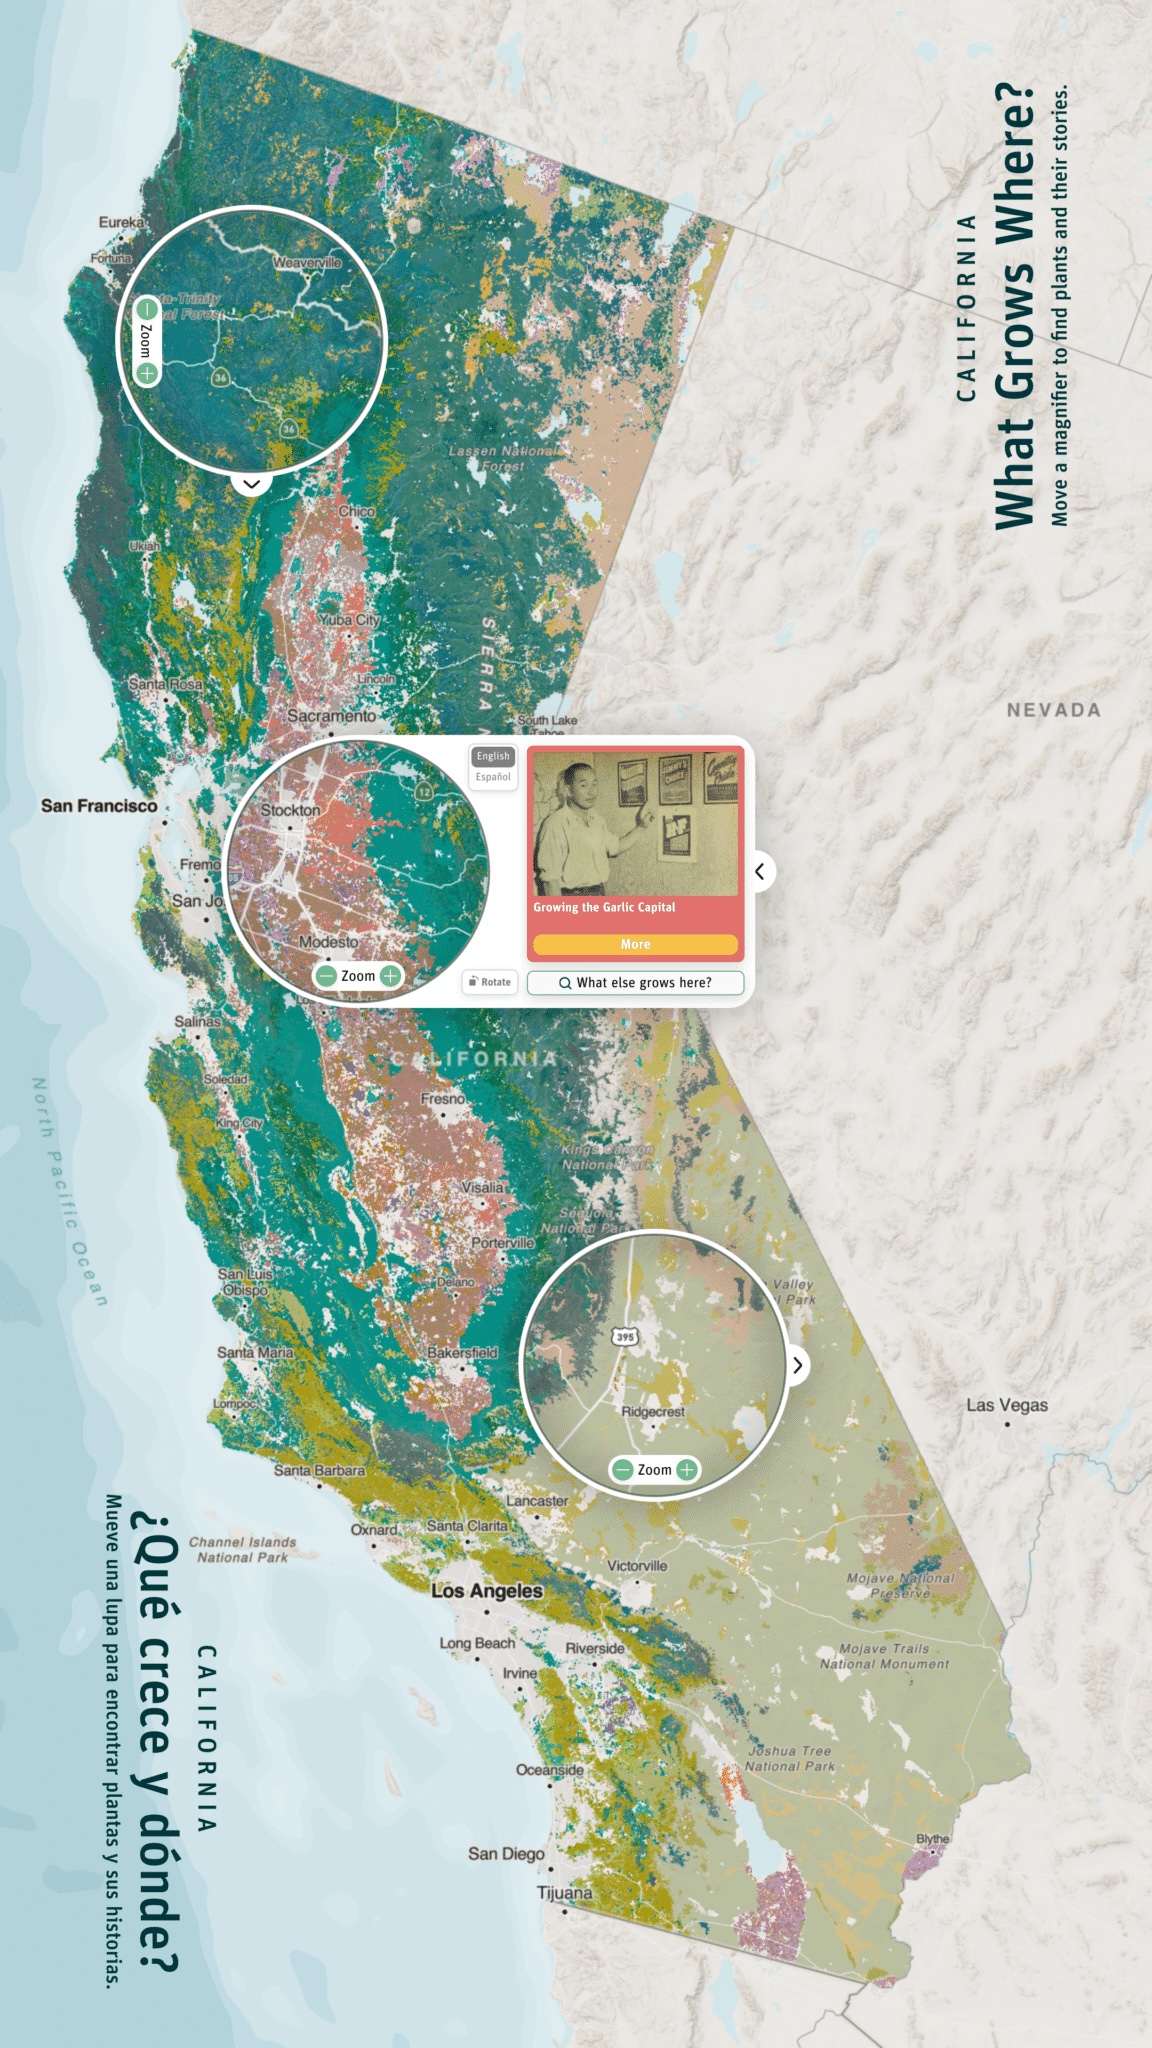
2/5 Cartography
Create a visually appealing and informative map of every California plant.
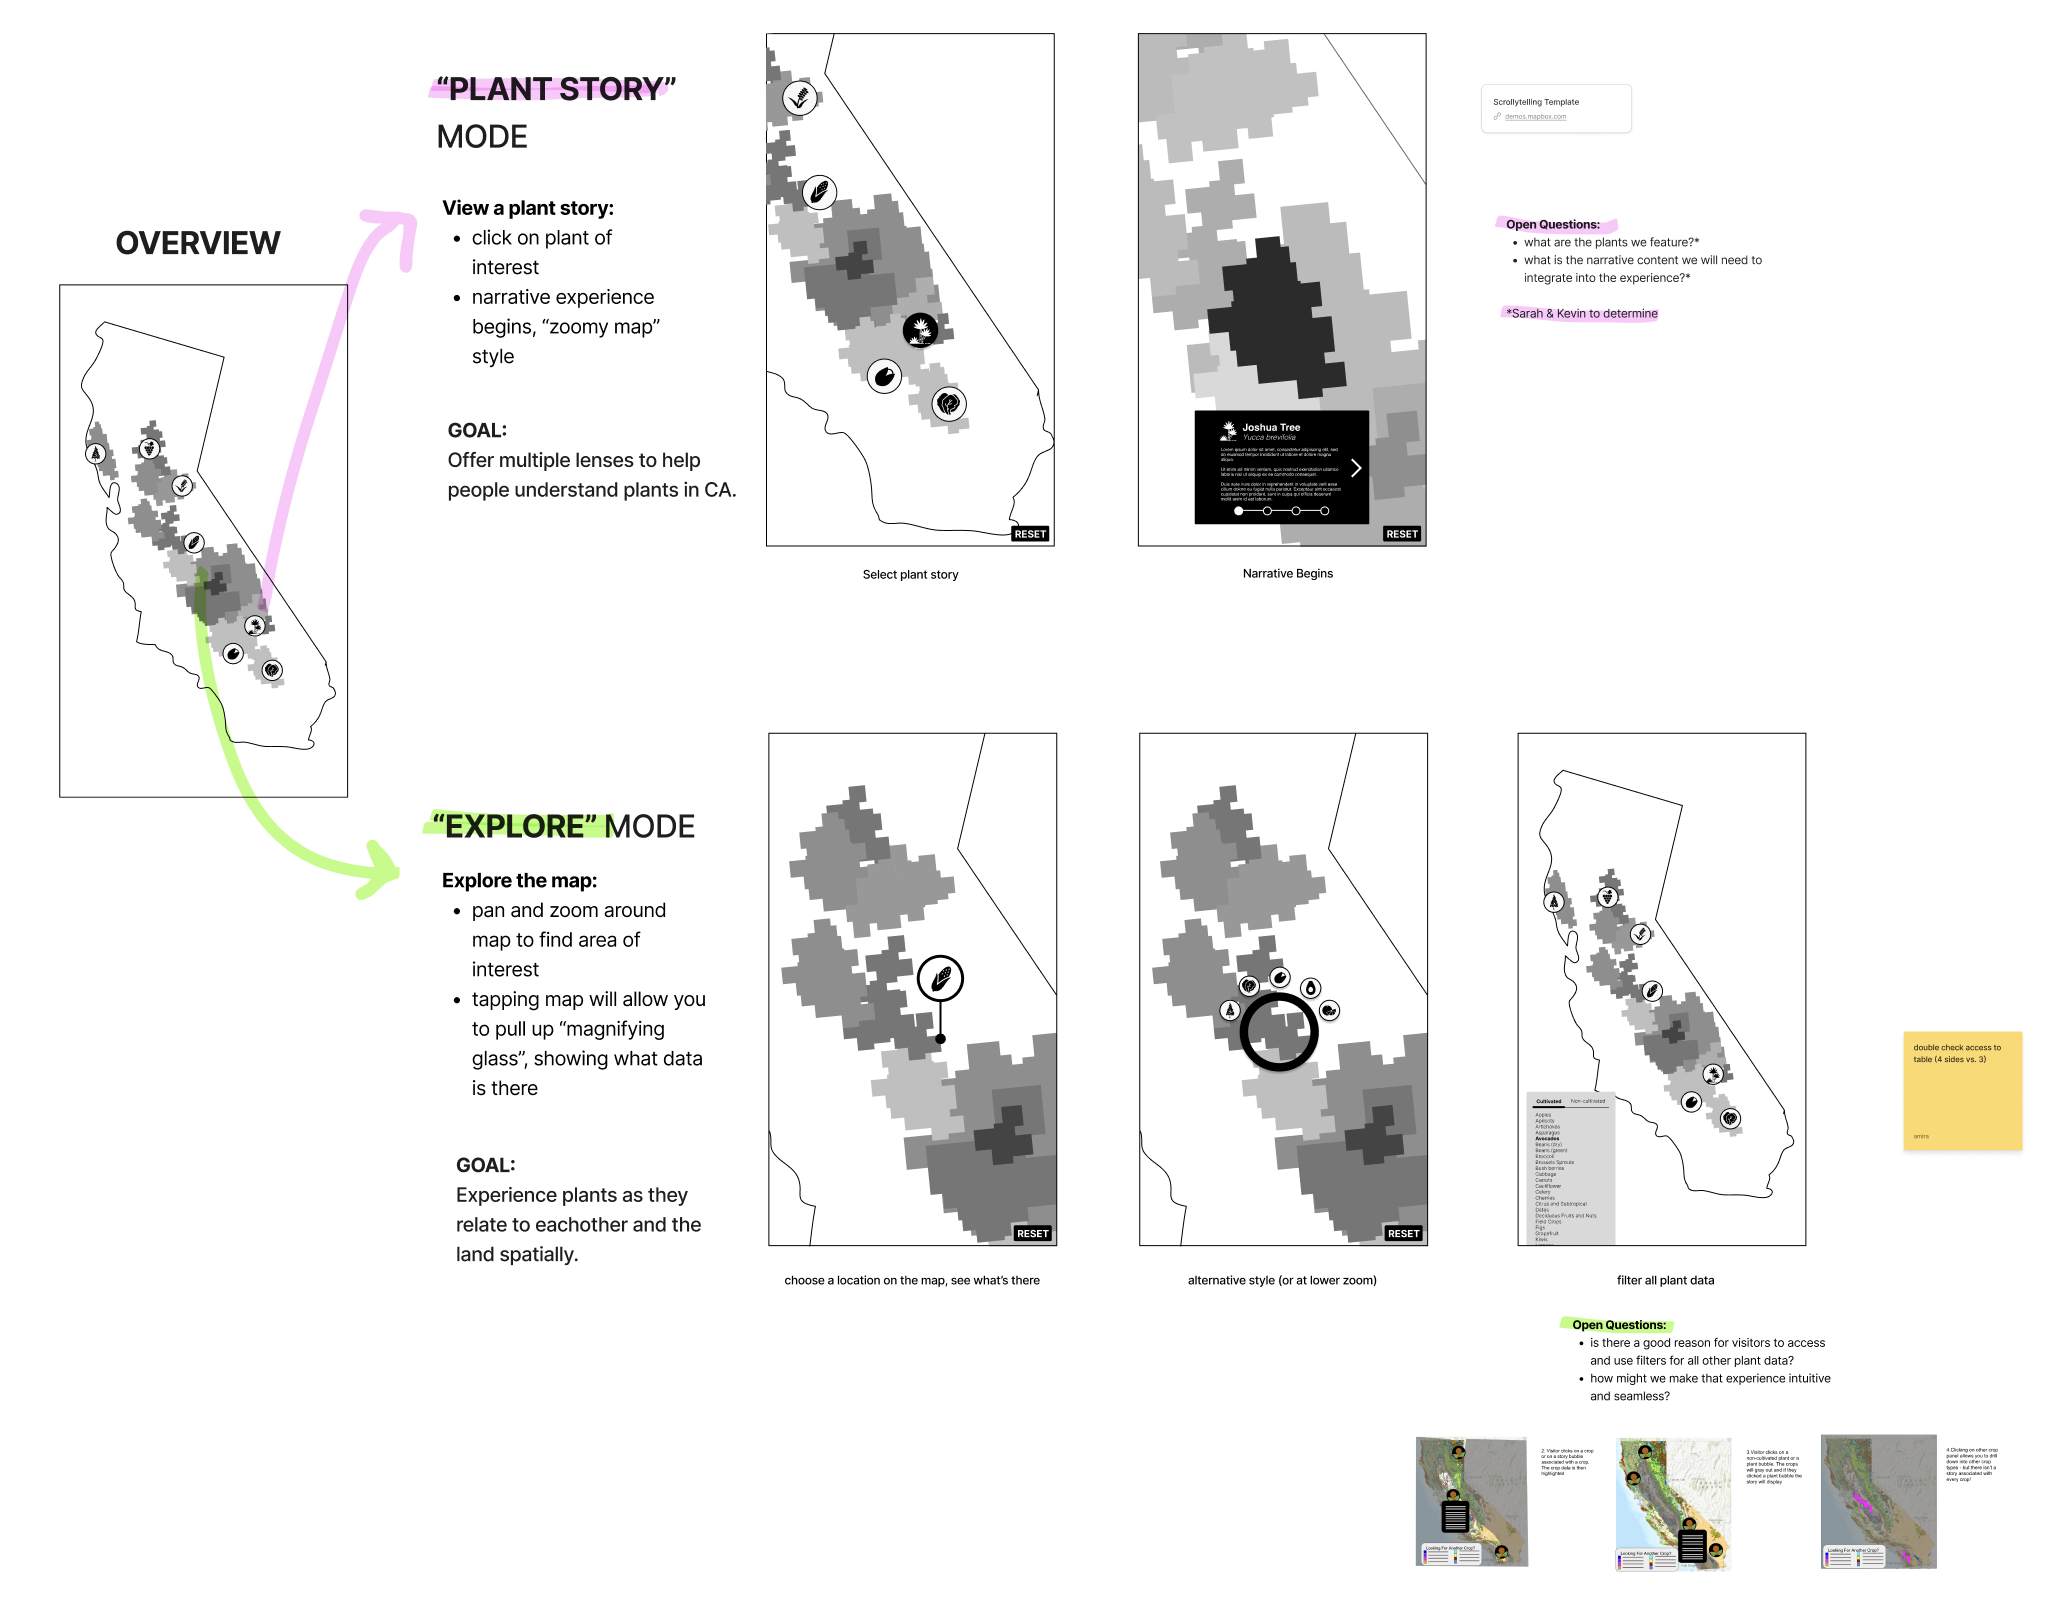
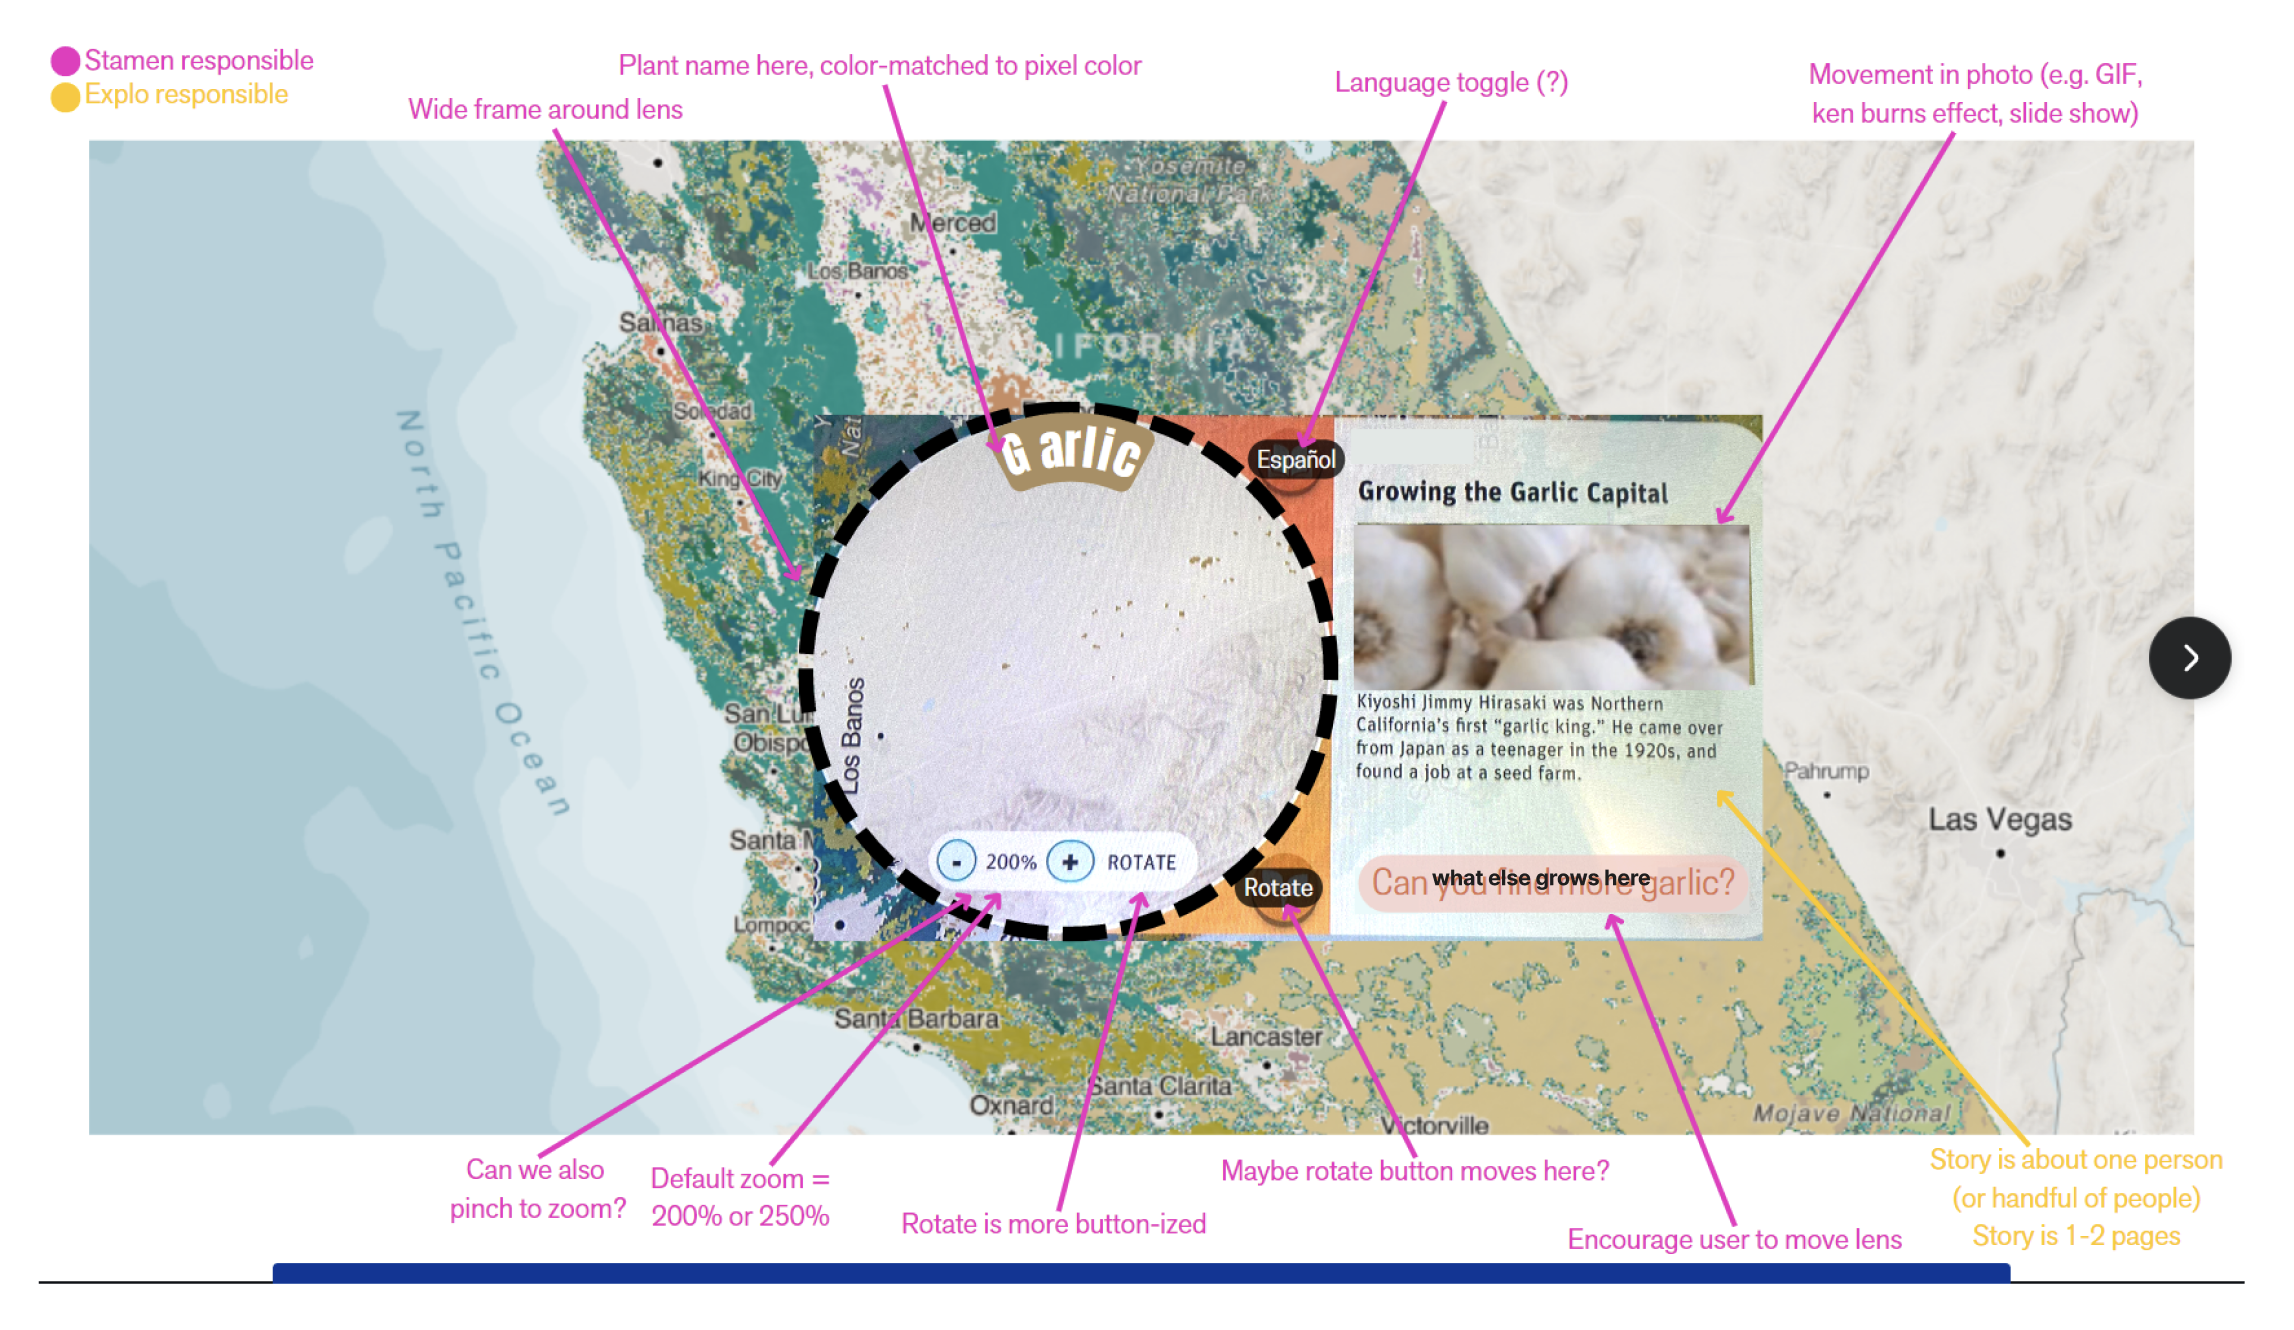
3/5 User interaction
Design an interface that lets users explore the data and read stories about people and plants.
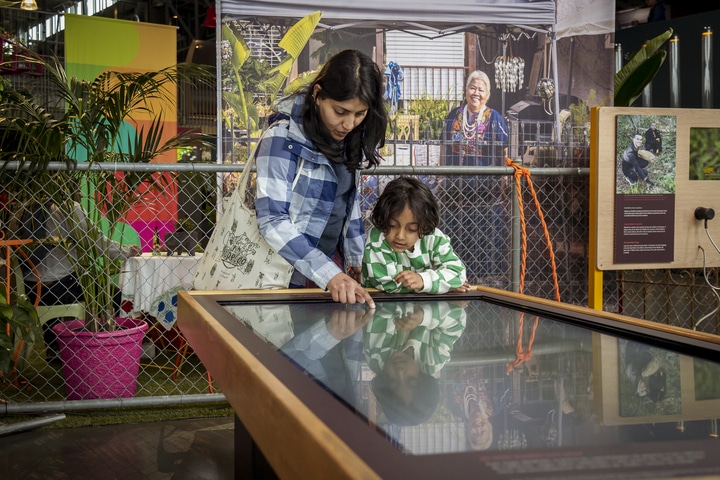
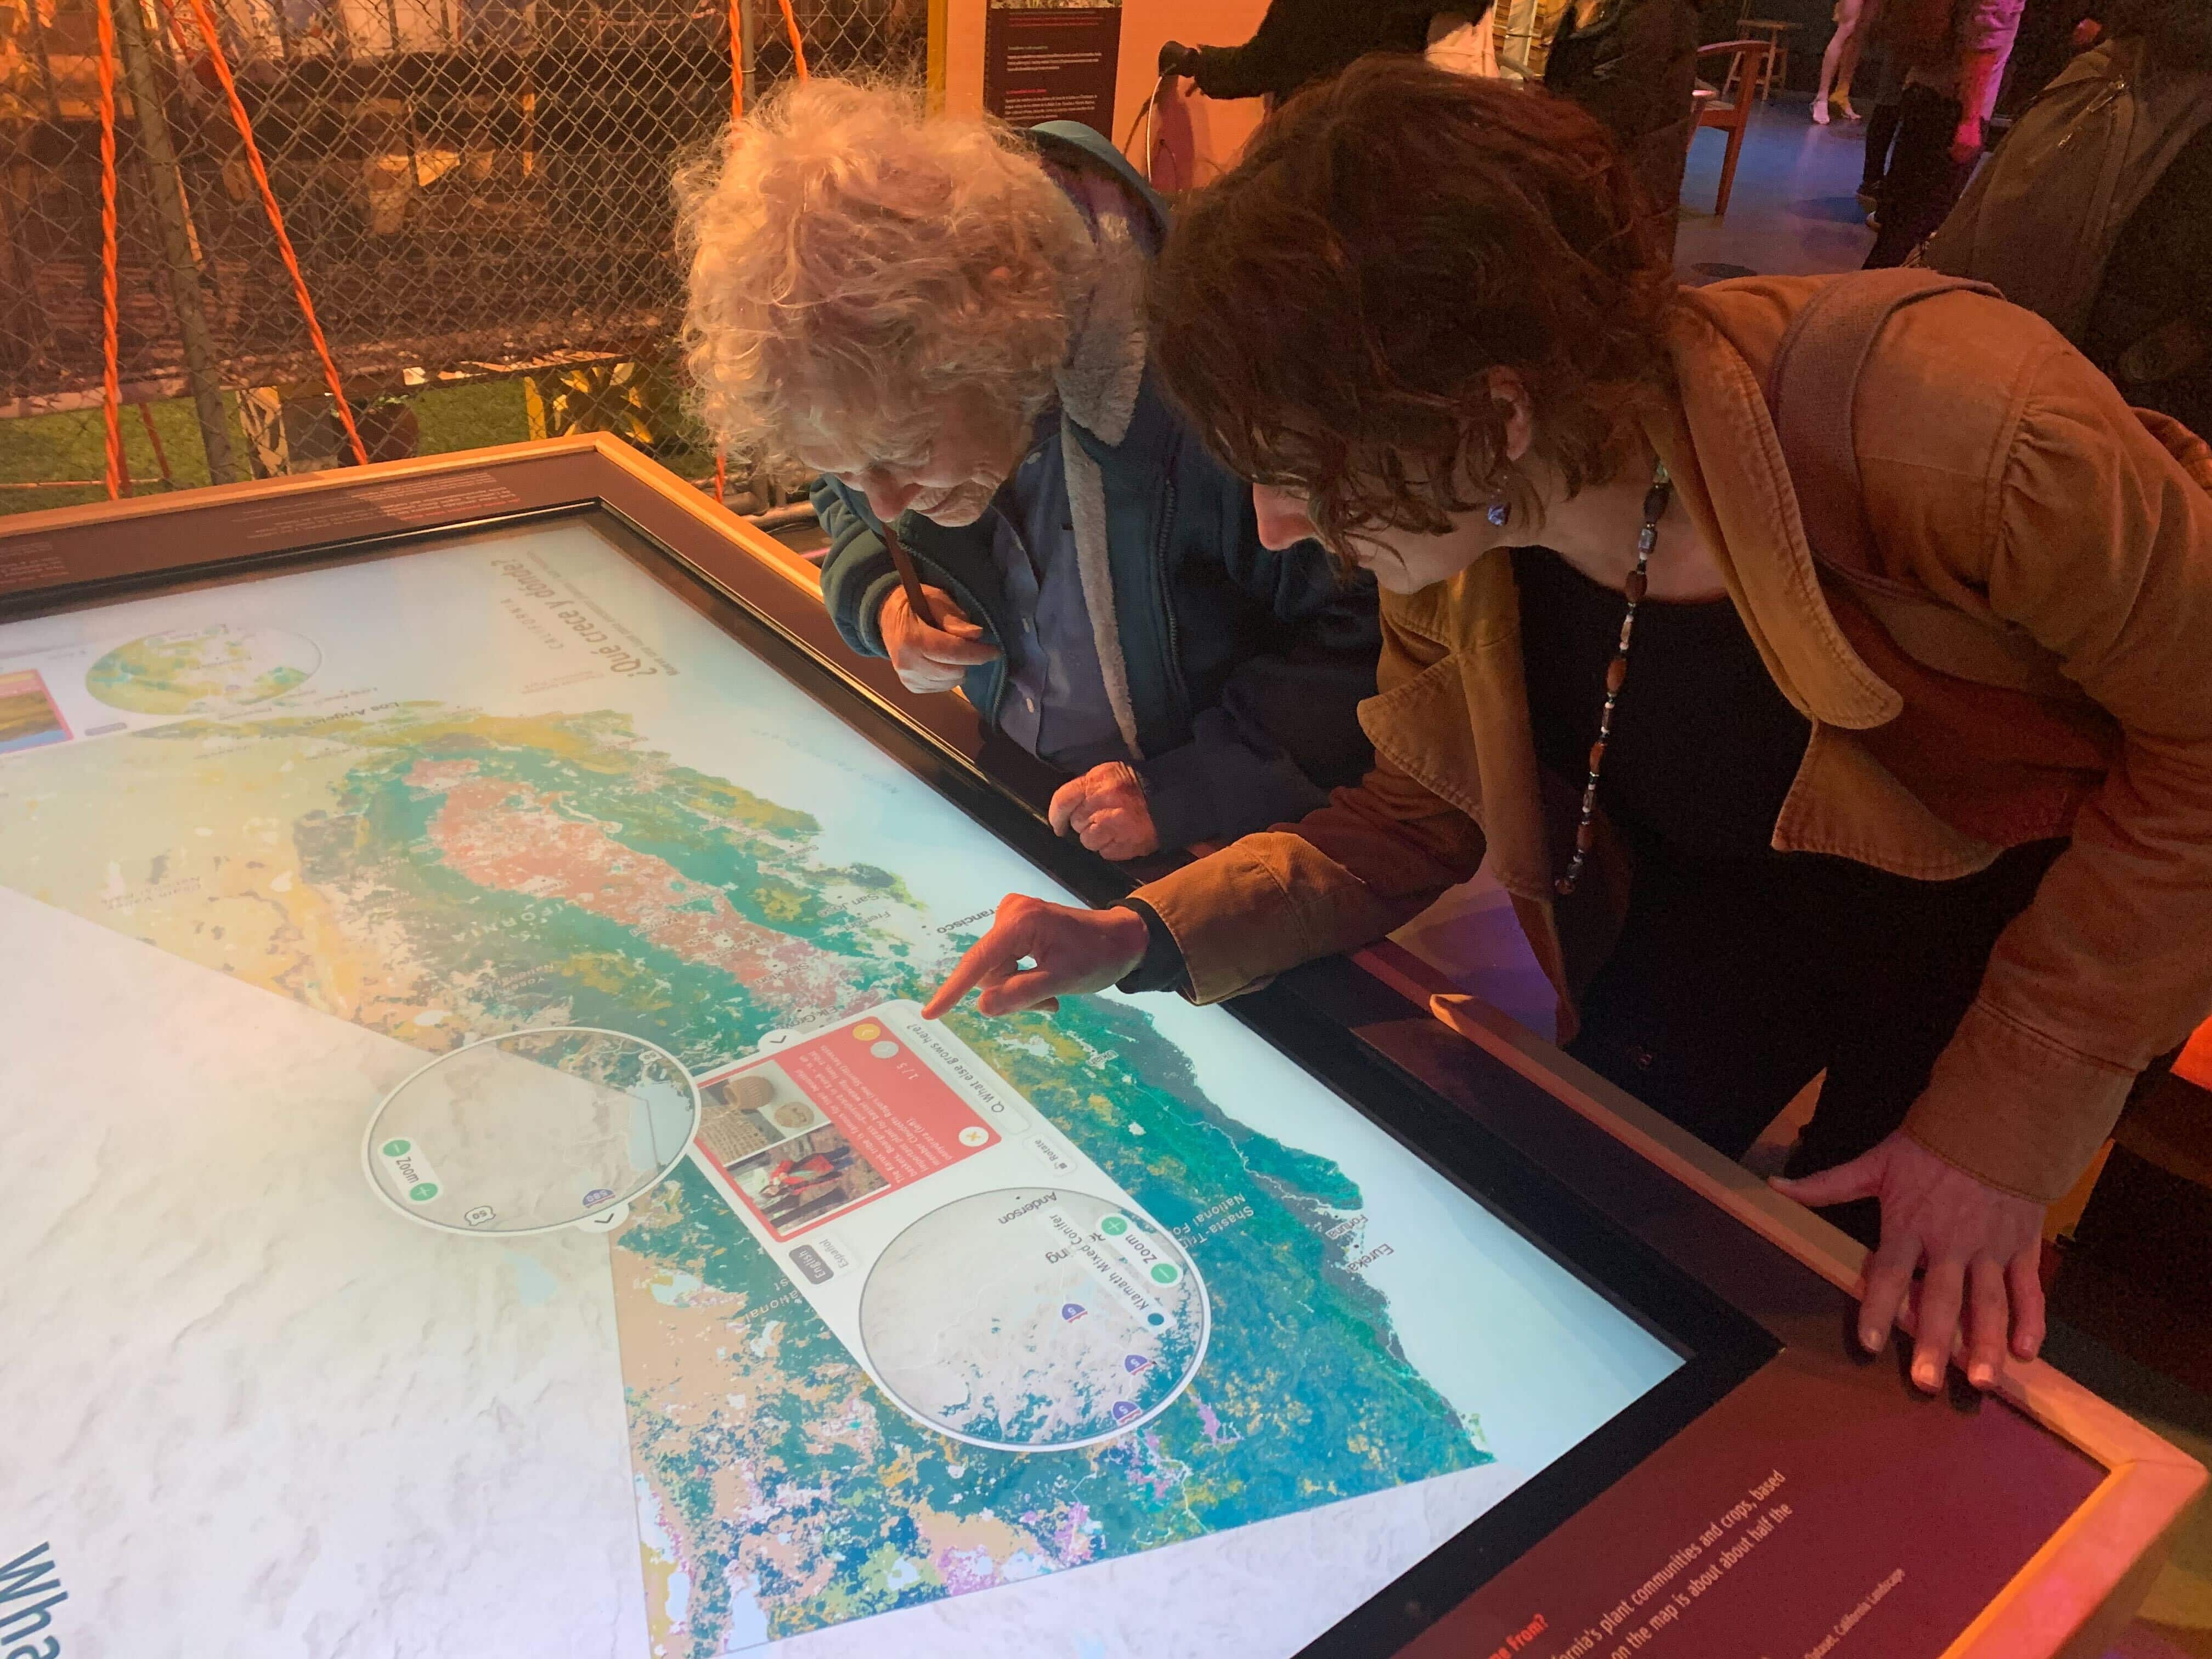
4/5 User testing
Test the product with museum guests.
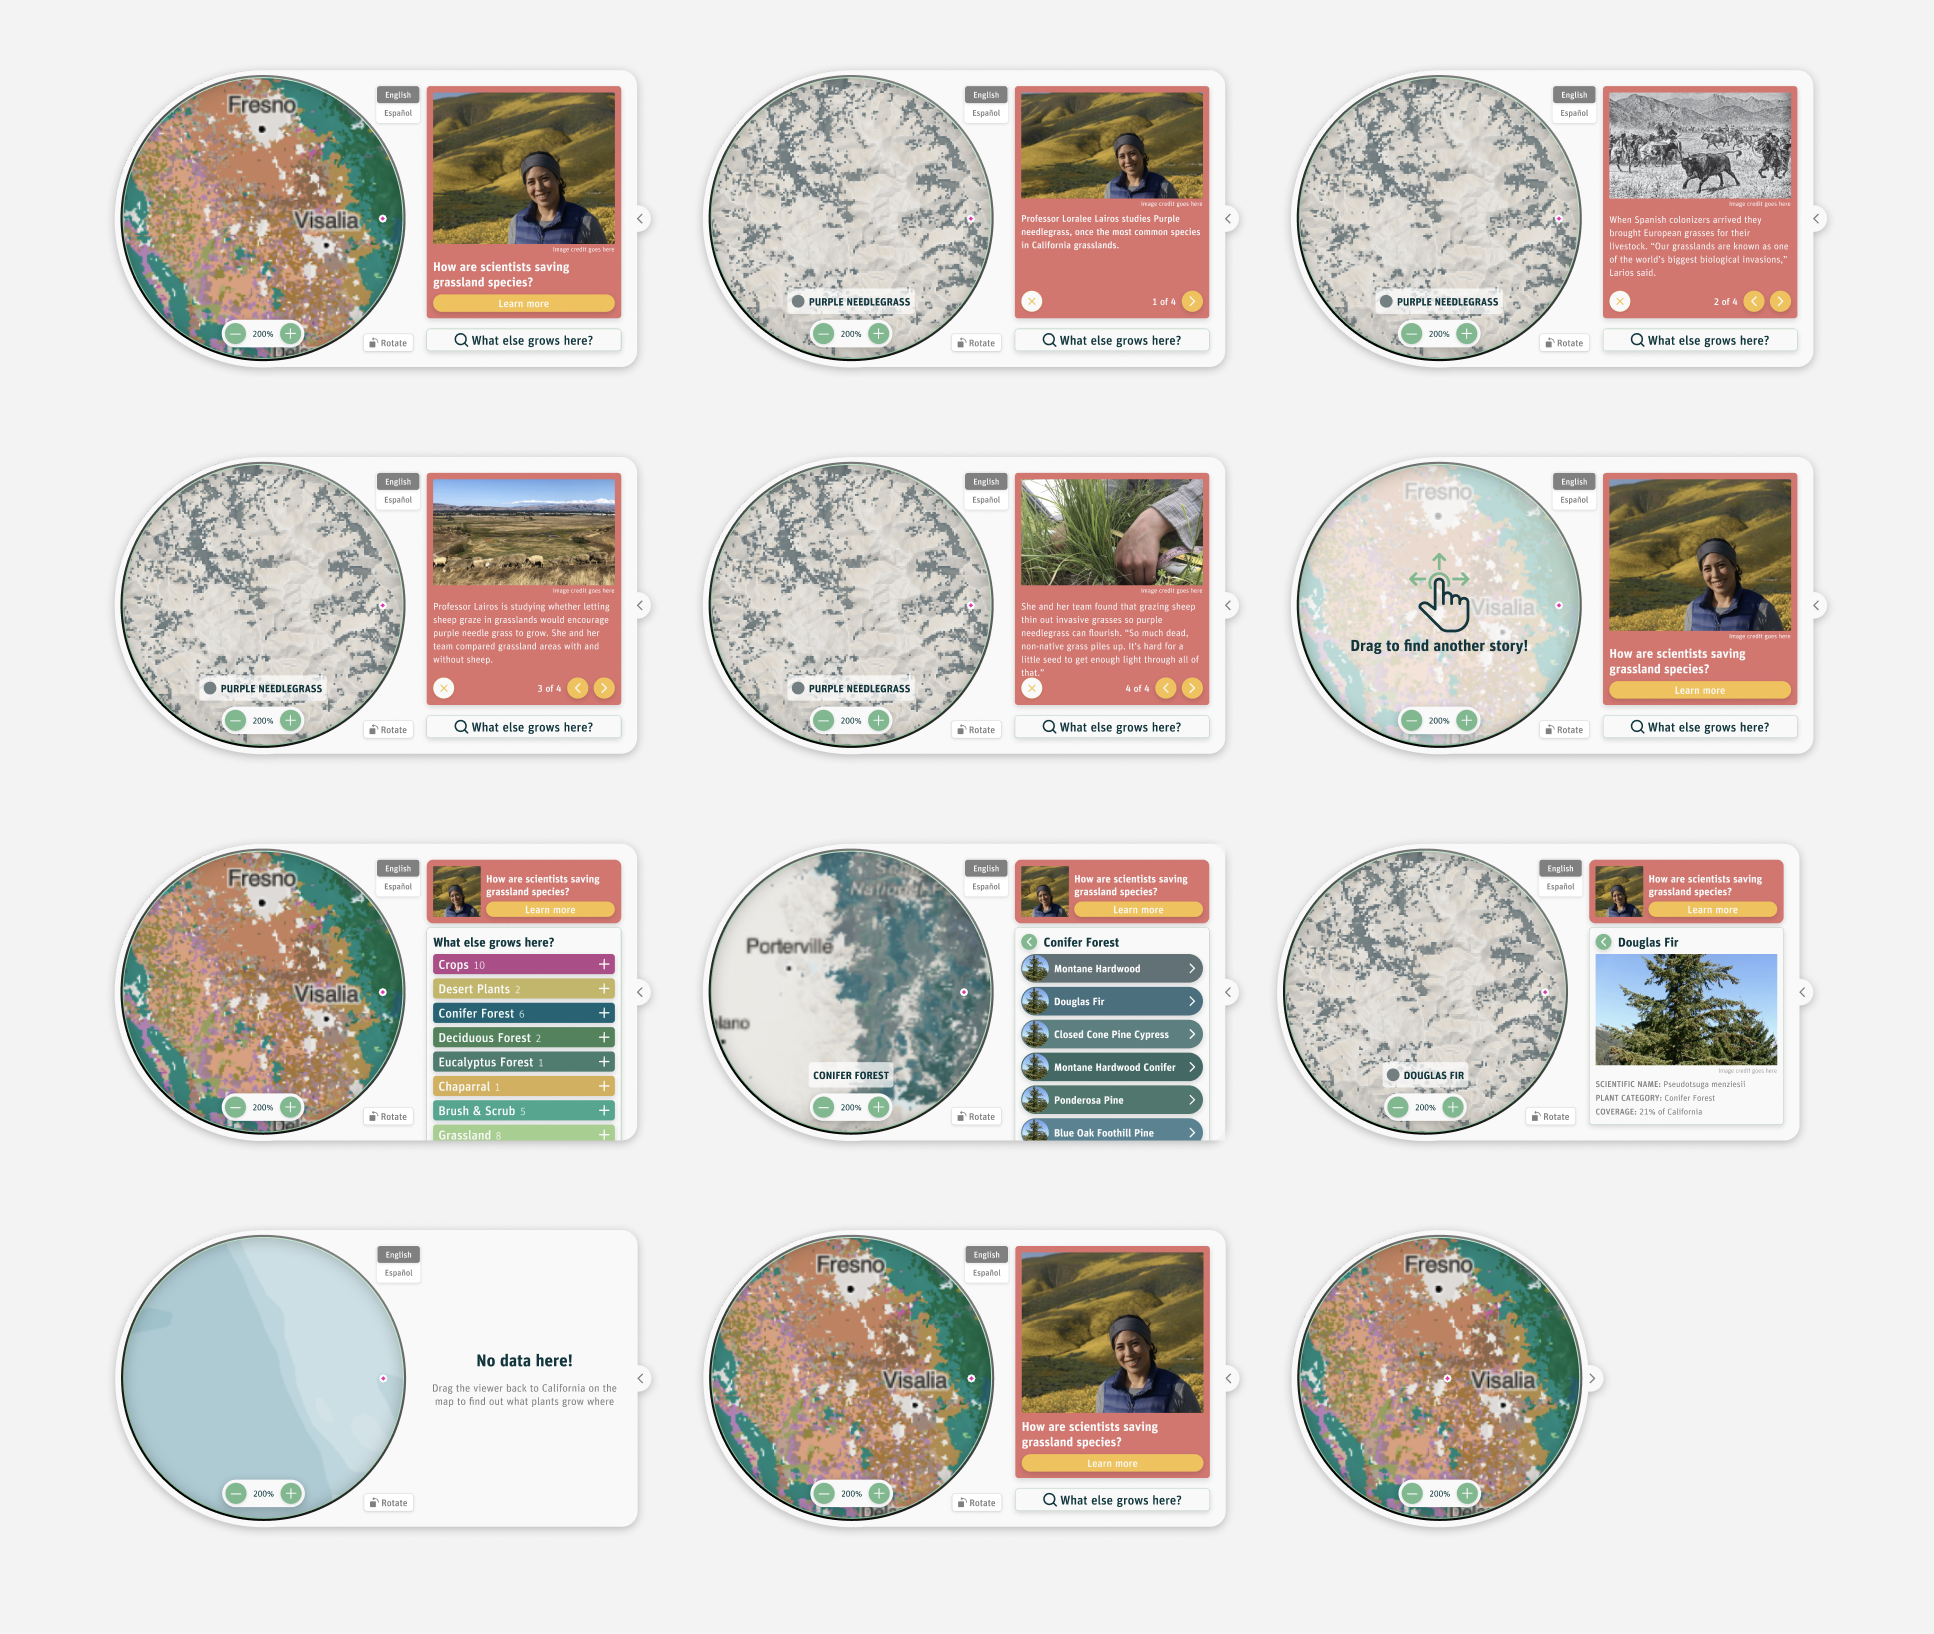
5/5 UI & Visual polish
Iterate and improve the design based on user feedback.
See Also
Need help visually sharing your stories with the world?
Let's be in touch soon!
cgcarter25@gmail.com
Website design and code by Caroline Carter... That's me!
