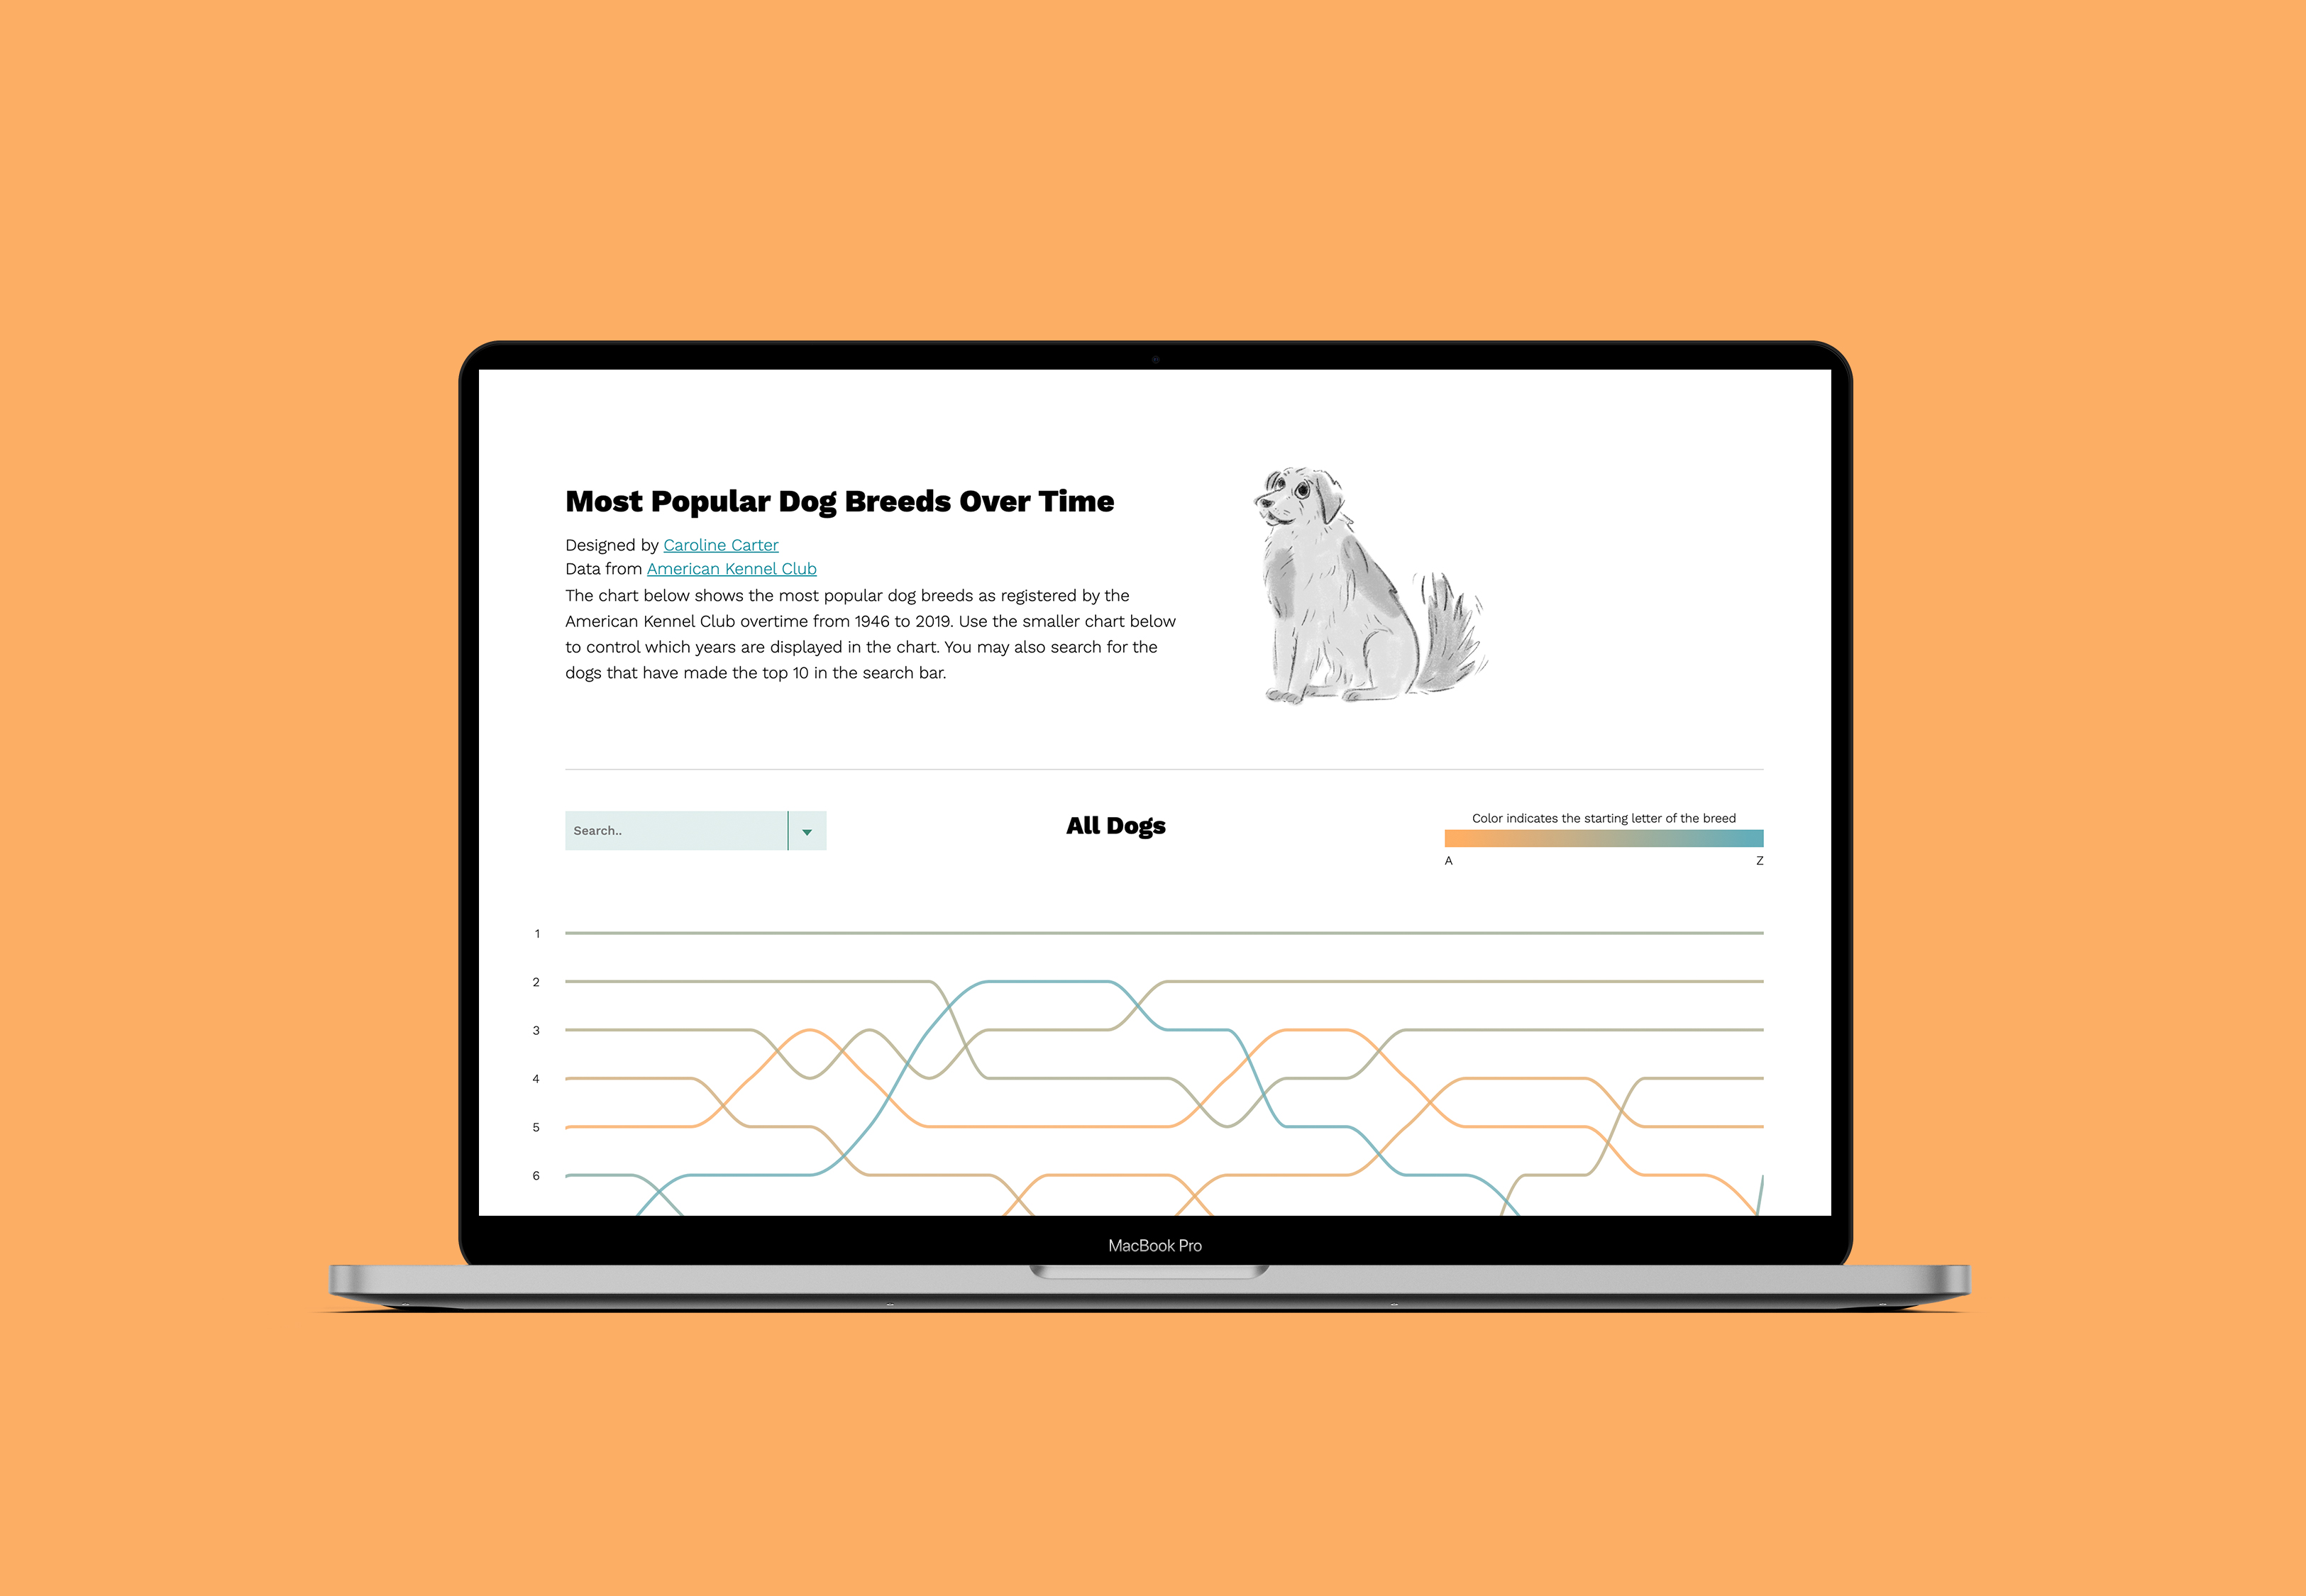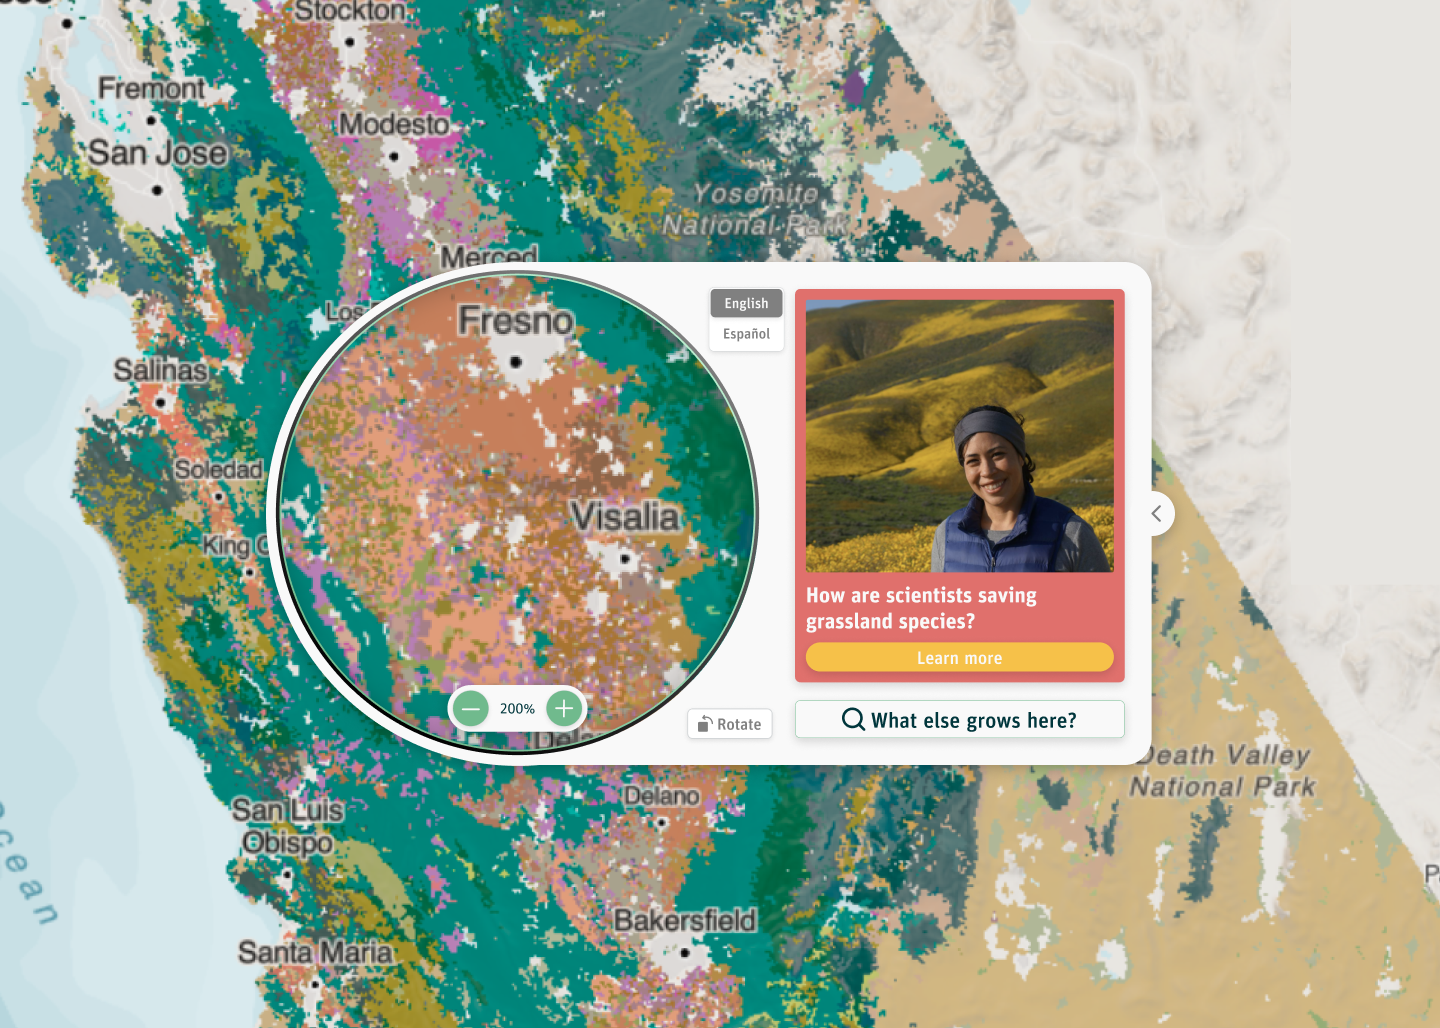
1/3 Research and Inspiration
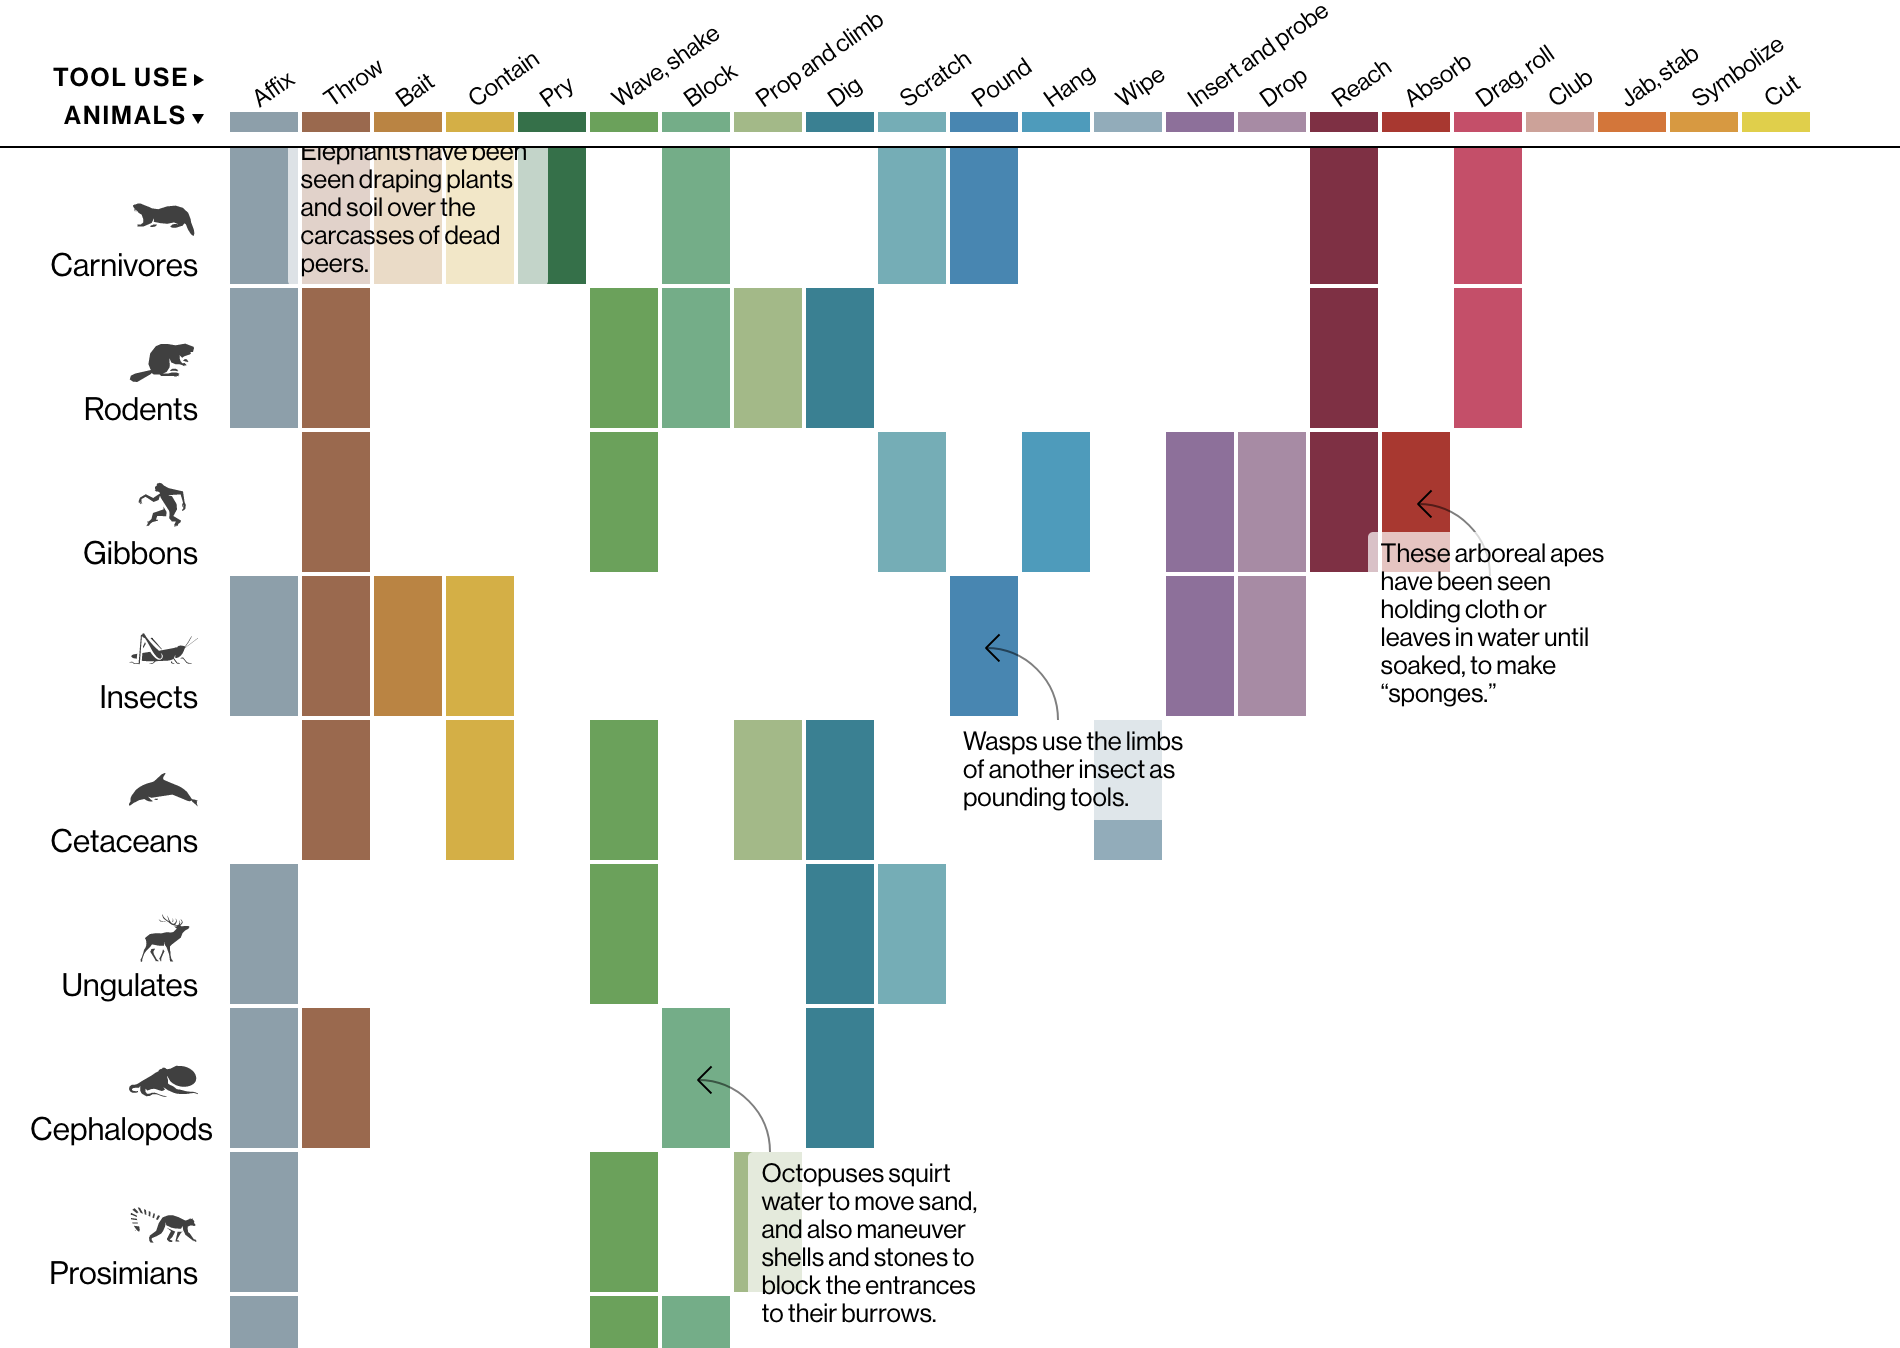
Determine ways to make this visualization better that I found when reading articles one day.
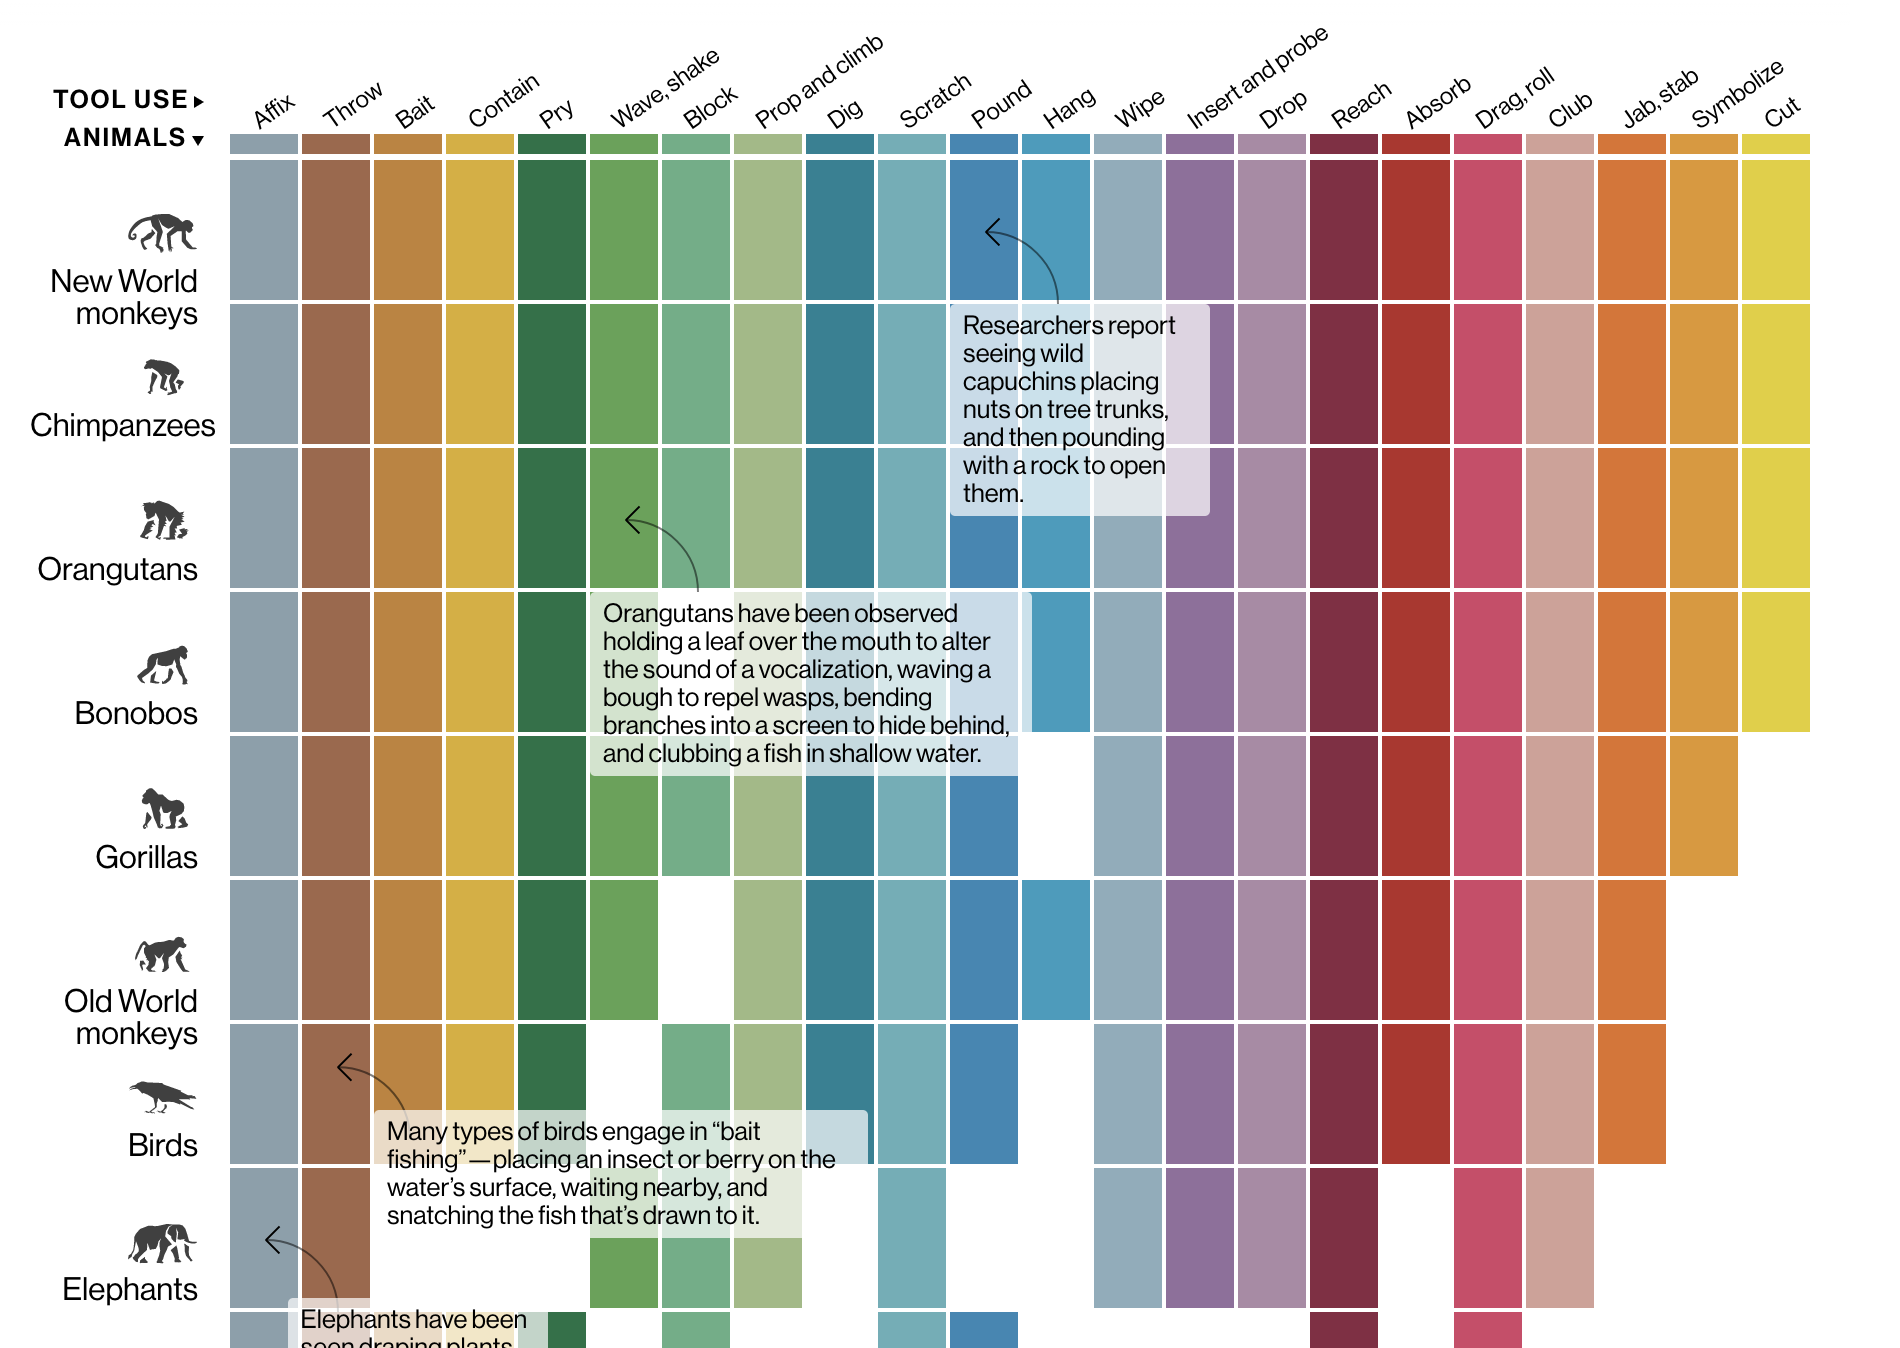
2/3 Data Collection
Compile data and information.
01
Record the animals and tool breakdowns from the book, "Animal Tool Behavior".
02
Format data into Microsoft Excel spreadsheet.
03
Clean the data for ease when using D3 to visualize the data.
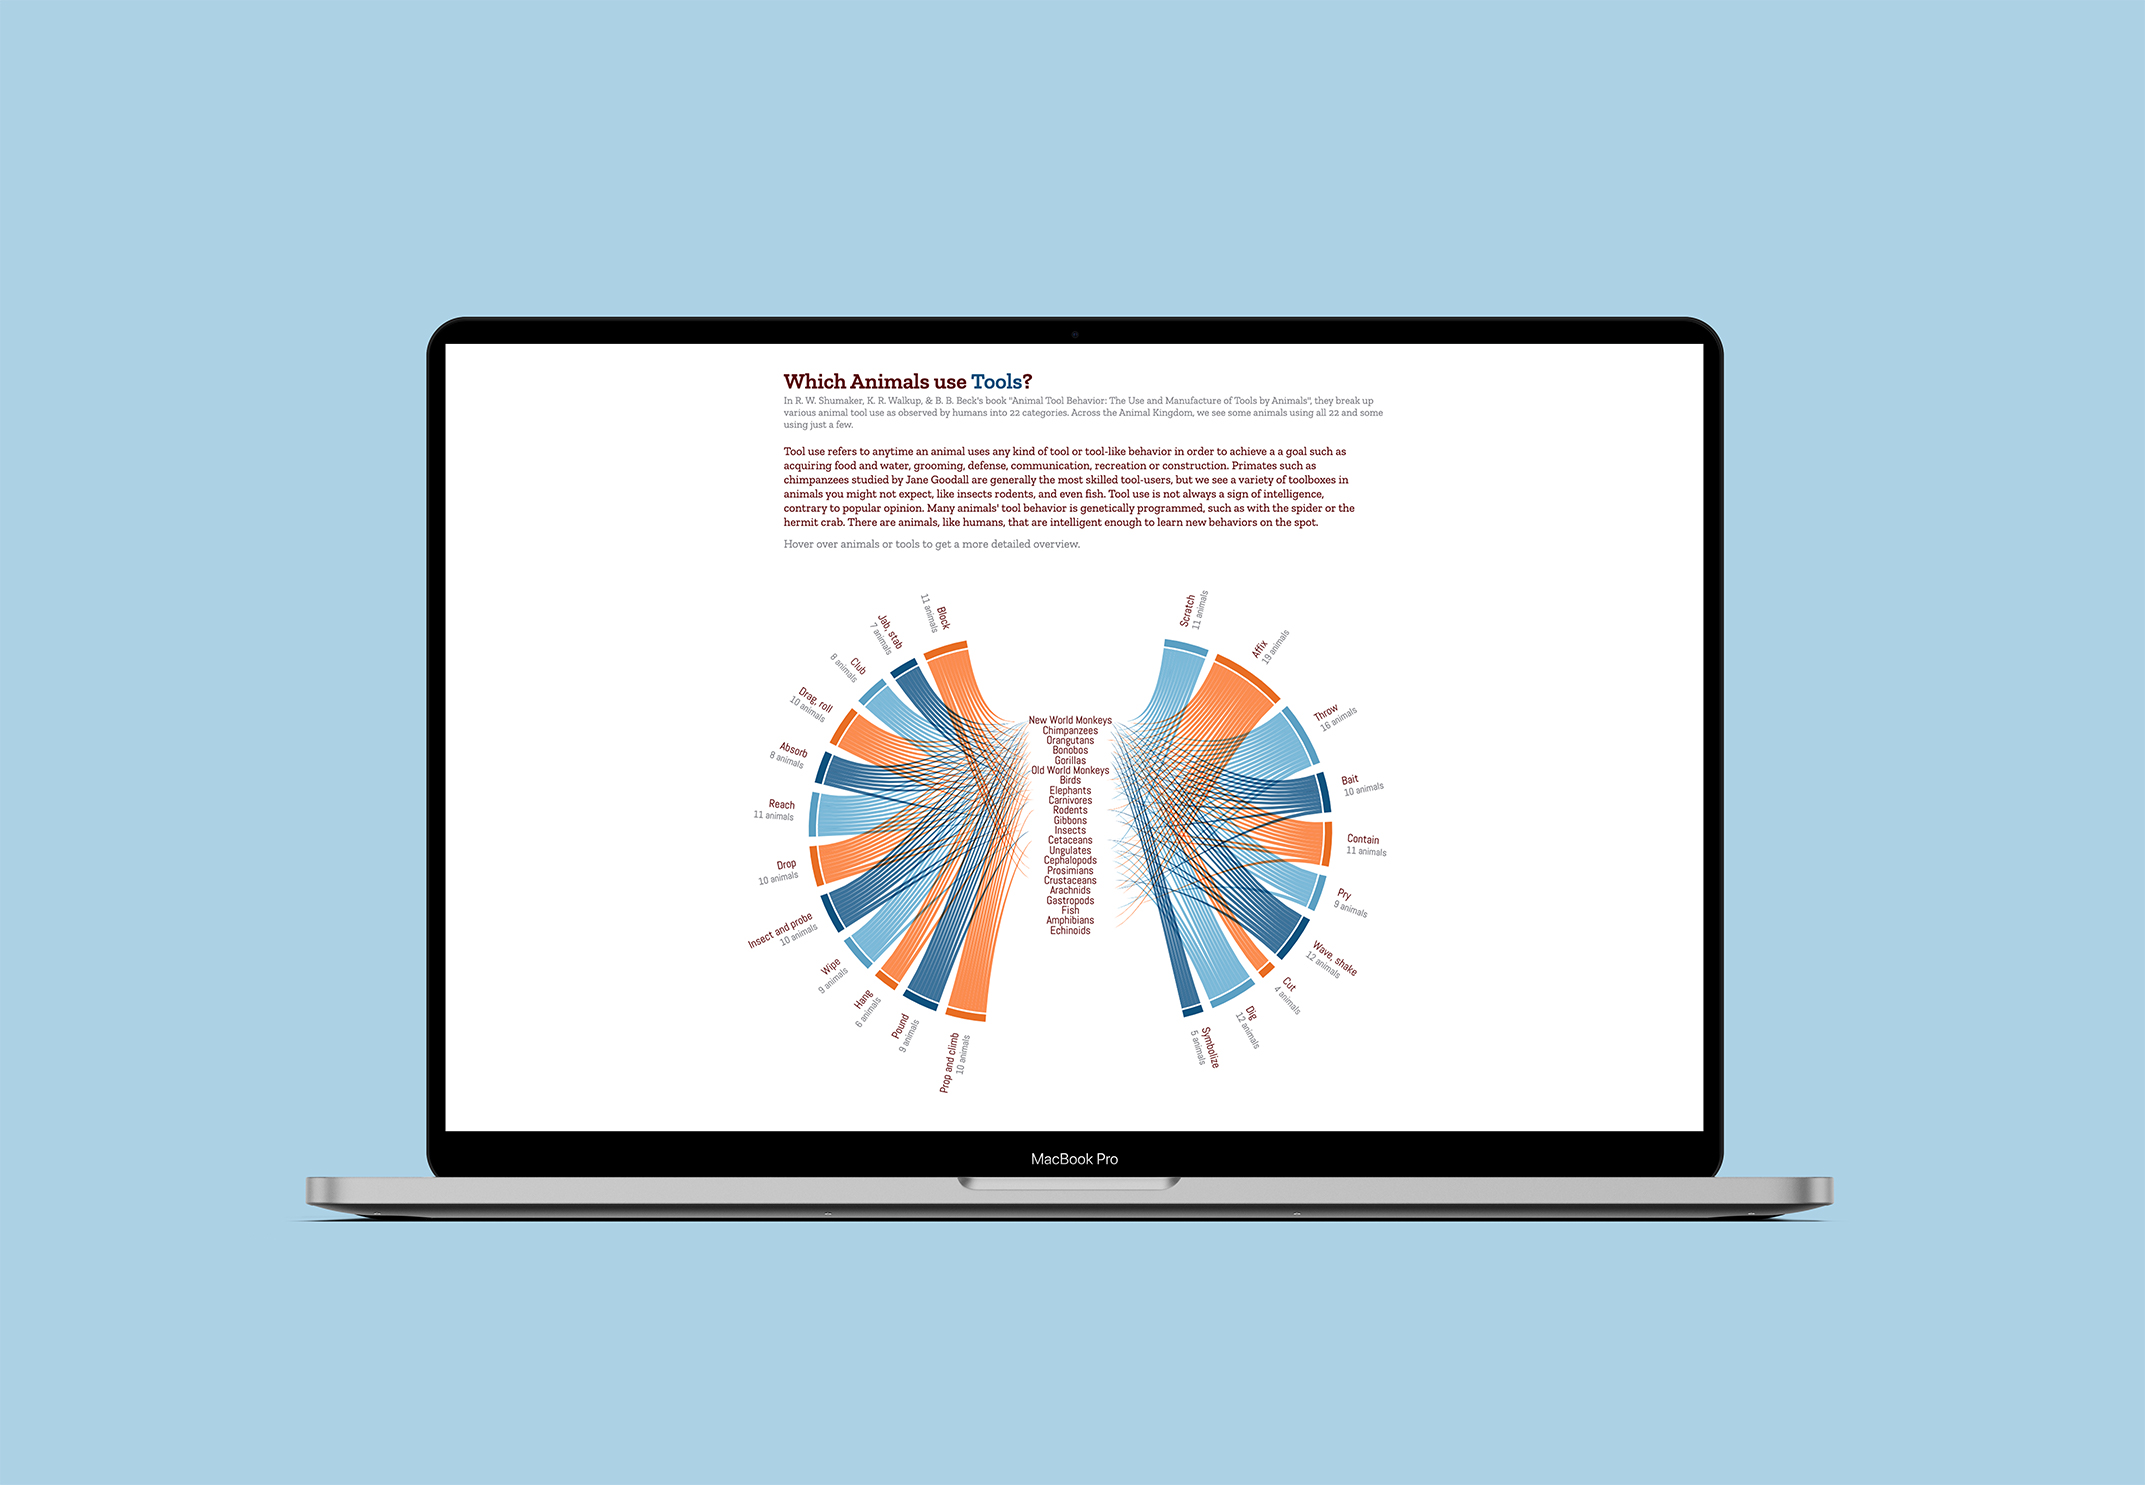
3/3 Development
Use D3 to code the prototype and add user interaction elements.
